. 2020 Oct 19;9:e61119. doi: 10.7554/eLife.61119

Figure 3. Mitofusin activation reverses neuromuscular dysfunction in MFN2 T105M mice.

(a) Ex vivo mitochondrial motility in CMT2A mouse sciatic nerve axons 4 hr after intramuscular administration of mitofusin activator MiM111 or vehicle. Top panel is kymographs. Bottom panel emphasizes motile mitochondria with red and blue lines transiting antegrade or retrograde, respectively. (Note, mitochondrial transport in ex vivo sciatic nerves favors the antegrade [spine to foot] direction because mitochondria are recruited to the site of nerve injury at the distal amputation site [Zhou et al., 2016]). (b) Experimental design to evaluate efficacy of MiM111 in late murine CMT2A. (c) RotaRod latency in vehicle- (green) and MiM111-treated (blue) MFN2 T105M mice. (d) Neuroelectrophysiology studies: (left) representative CMAP tracings; (right) quantitative data. Each symbol in c and d is one mouse. P values from ANOVA. WT control values are open circles in panels c and d; complete WT control data are in Figure 3—figure supplement 2.

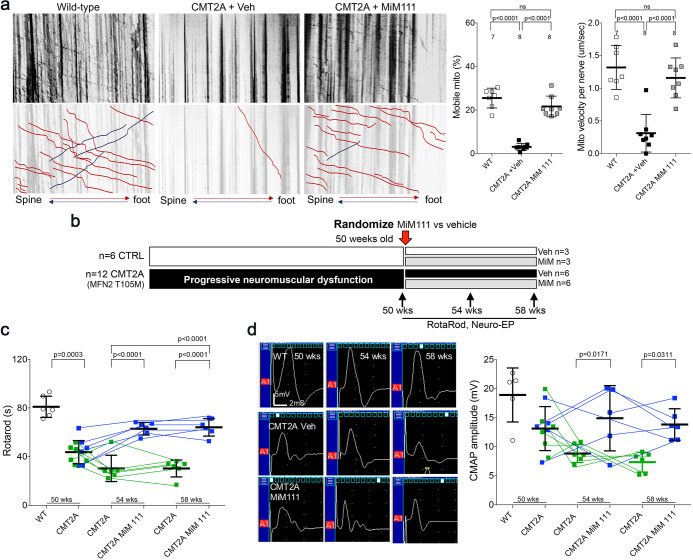
Figure 3.

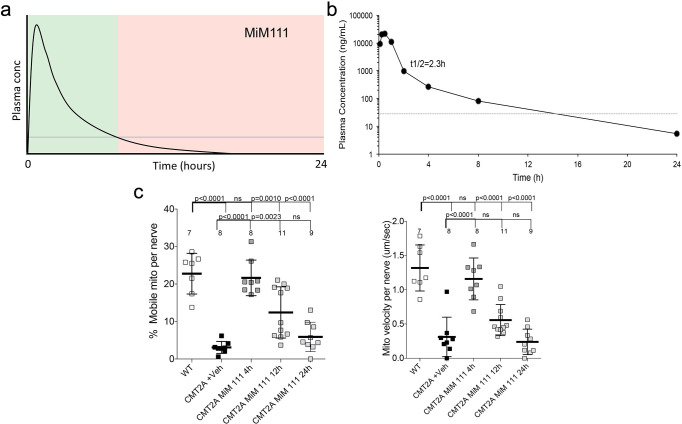
Figure 3—figure supplement 1. In vivo pharmacokinetics and target engagement of MiM111 administered intramuscularly.

Figure 3—figure supplement 1.

(a) Predicted temporal relationship between plasma MiM111 concentration and peripheral nerve mitochondria activation based on published data (reference 25). Green indicates postulated therapeutic levels; pink indicates postulated sub-therapeutic levels. (b) In vivo plasma concentrations of MiM111 after a single dose of 30 mg/kg administered intramuscularly (means of 2 mice). (c) Time-dependent MiM111 target engagement measured as the increase in proportions (left) and velocity (right) of mobile mitochondria in sciatic nerve axons of CMT2A MFN2 T105M mice. Each point represents a single neuronal axon, from 2 or three mice per time point. WT is normal. P values by ANOVA.
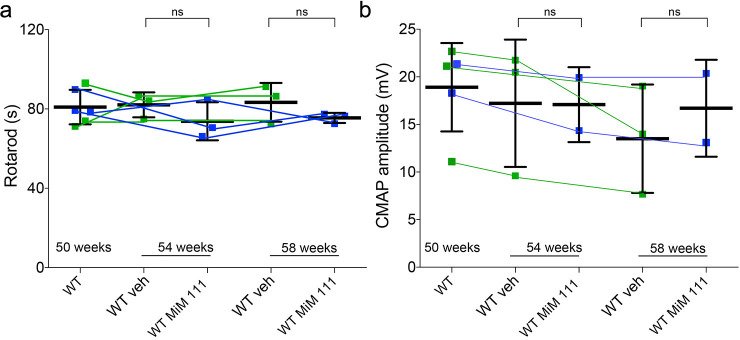
Figure 3—figure supplement 2. Effects of MiM111 on neuromuscular function in control mice.

Figure 3—figure supplement 2.

(a) RotaRod latency. (b) Neuroelectrophysiologic CMAP amplitude. Each point is a mouse; green is vehicle (n = 3), blue is MiM111 30 mg/kg IM once daily (n = 3). There were no differences (t-test).