. 2020 Oct 26;9:e60234. doi: 10.7554/eLife.60234

Figure 2. Midline cells do not undergo apical remodeling during cranial neural fold elevation.

(A) Midline cells at progressive stages of neural fold elevation. Cells are labeled with ZO-1 (top) and are color-coded by apical area (bottom). (B,C) Average apical cell area (B) and apical area distributions (C) of midline cells during midbrain neural fold elevation. A single value was obtained for each embryo and the mean ± SD between embryos is shown, n = 3 embryos/stage, no significant differences (one-way ANOVA test). See Supplementary file 1 for n and p values. Anterior up. Bar, 20 μm.

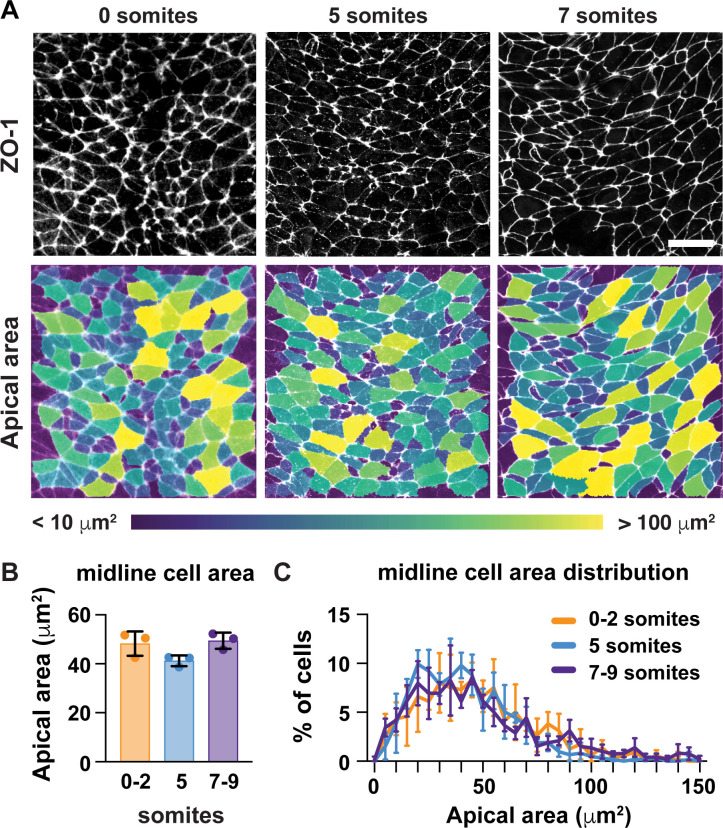
Figure 2.

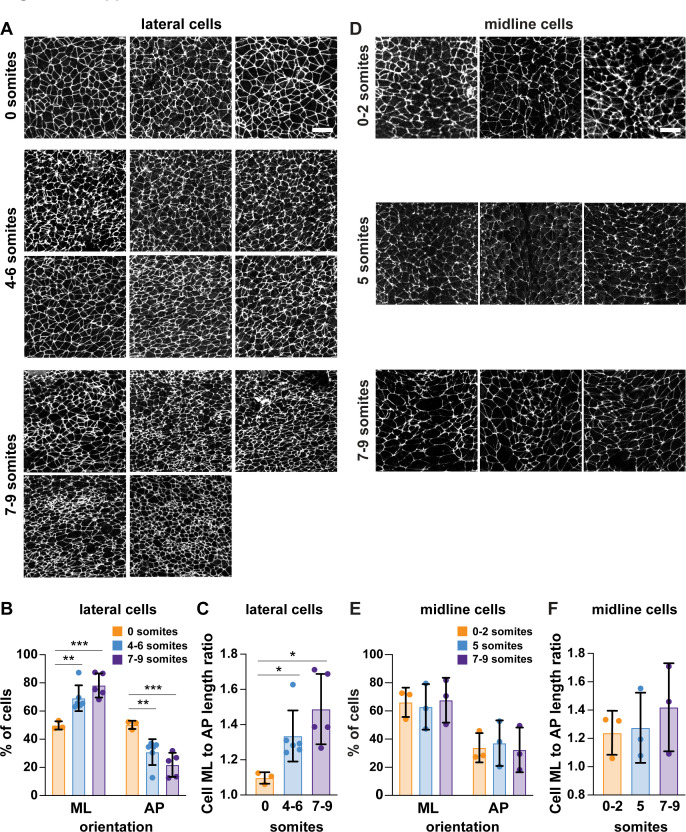
Figure 2—figure supplement 1. Analysis of mediolateral cell orientation in midline and lateral cells.

Figure 2—figure supplement 1.

(A,D) One of the two 100 μm x 100 μm lateral regions analyzed in each wild-type embryo (A) and all midline regions analyzed in wild-type embryos (one image/embryo) (D) are shown. (B,E) Percentage of lateral (B) and midline (E) cells with a mediolateral (ML) orientation (0–45° relative to the ML axis) or an anterior-posterior (AP) orientation (45–90° relative to the ML axis) at progressive stages of elevation. (C,F) The average ratio of cell length along the ML axis to cell length along the AP axis in lateral (C) and midline (F) cells. A single value was obtained for each embryo and the mean ± SD between embryos is shown. n = 3–6 embryos/stage, *p<0.05, **p<0.01, ***p<0.001, two-way ANOVA test (B,E) or Brown-Forsythe and Welch one-way ANOVA test (C,F). See Supplementary file 1 for n and p values. Anterior up. Bars, 20 μm.