. 2020 Oct 26;9:e60234. doi: 10.7554/eLife.60234

Figure 4. IFT-A proteins have an early role in cranial neural tube closure.

(A) Wild-type littermate control (WT) showing normal cranial closure. (B,C) Exencephaly was observed in 10/10 Ift122 mutants (B) (compared with 0/16 WT controls) and 5/5 Ttc21b mutants (C) (compared with 0/13 WT controls). Dashed lines, lateral edge of the cranial neuroepithelium. (D–F) The cranial neural folds fail to elevate in Ift122 (E) and Ttc21b (F) mutants compared to WT controls (D). Box, region shown in (G–I). (G–I) Lateral cells in WT and mutant embryos. Cells are labeled with ZO-1 (top) and are color-coded by apical area (bottom). (J–M) Average apical cell area (J,L) and apical area distributions (K,M) of lateral cells in Ift122 and Ttc21b mutants compared with WT controls. A single value was obtained for each embryo and the mean ± SD between embryos is shown, n = 3–4 embryos/genotype, **p<0.01 (Welch’s t-test). See Supplementary file 1 for n and p values. Anterior up in (A–C) and (G–I), anterior left in (D–F). Bars, 1 mm (A–C), 100 μm (D–F), and 20 μm (G–I).

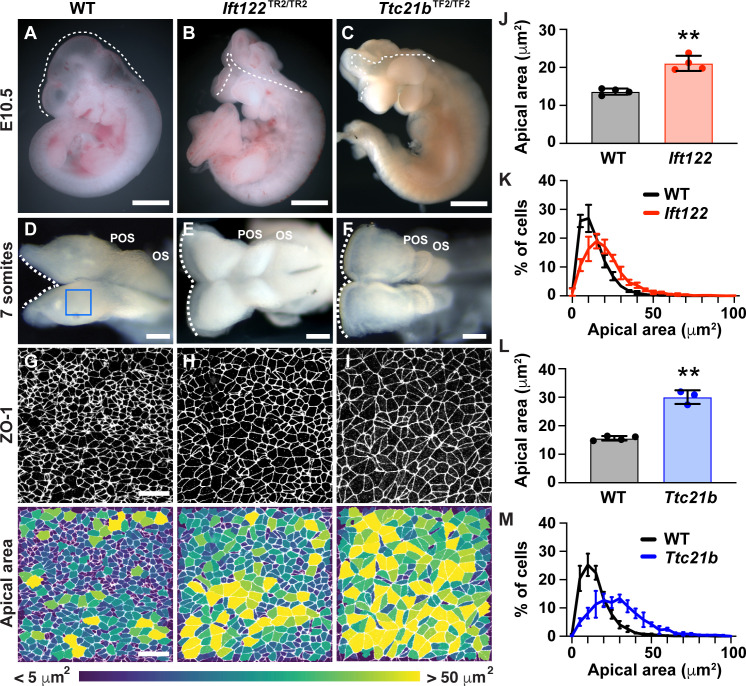
Figure 4.

Figure 4—figure supplement 1. Novel Ift122 and Ttc21b alleles have defects in ciliogenesis.

Figure 4—figure supplement 1.

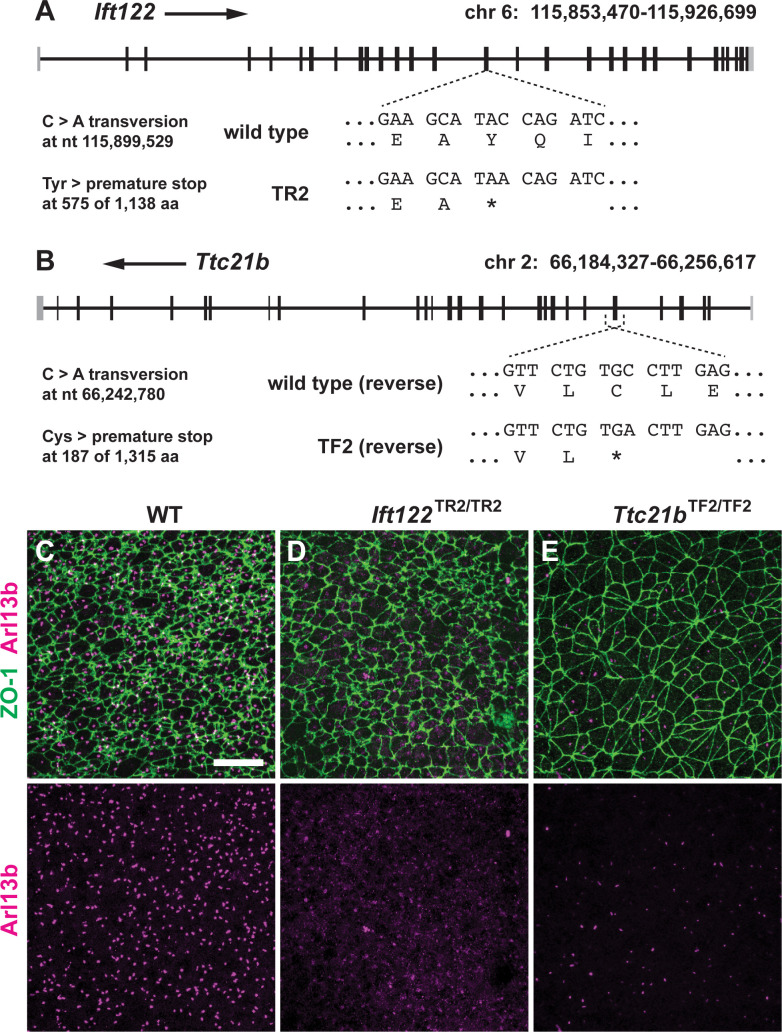
(A,B) Mouse Ift122 (A) and Ttc21b (B) loci showing the Ift122TR2 and Ttc21bTF2 mutations. (C–E) Localization of ZO-1 and the cilia marker Arl13b in lateral cells of the midbrain neural plate at 7–8 somites. Note the reduction in Arl13b staining in Ift122 and Ttc21b. Anterior up. Bar, 20 μm.
Figure 4—figure supplement 2. Ift122 and Ttc21b mutants display a persistent failure of neural fold elevation.

Figure 4—figure supplement 2.

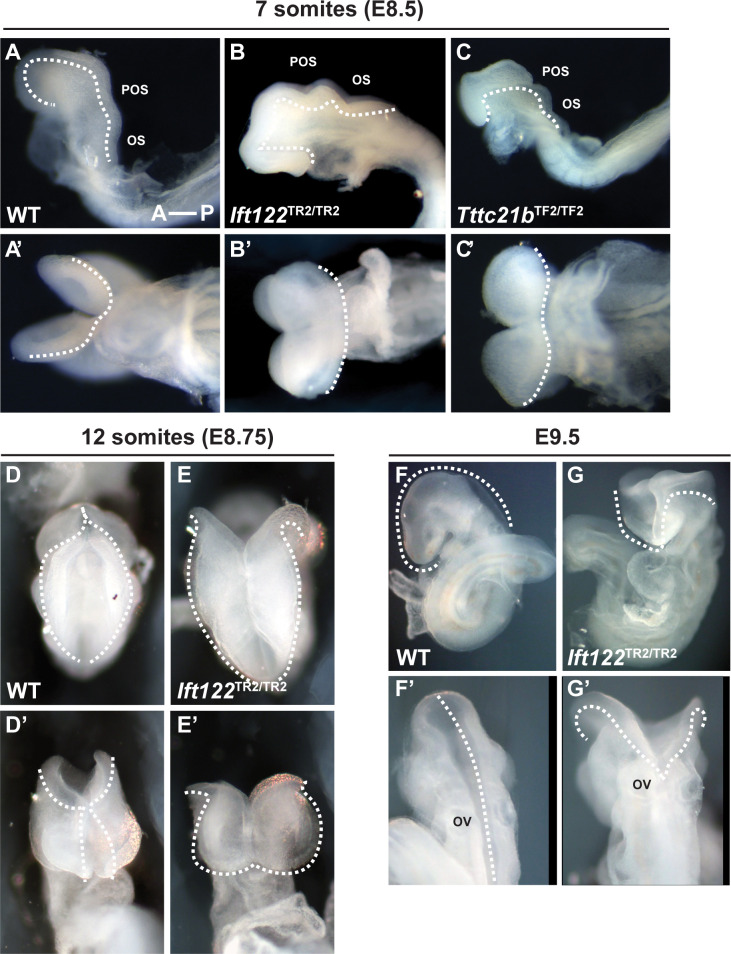
(A–C’) Ift122 and Ttc21b embryos at seven somites compared with a wild-type (WT) littermate control. Top panels, side views. Bottom panels, ventral views. Note the failure of neural fold elevation in Ift122 and Ttc21b mutants. POS, pre-otic sulcus; OS, otic sulcus. Anterior left. (D–E’) Ift122 embryos at 12 somites compared with a WT littermate control. Top panels, dorsal views. Bottom panels, frontal views. Lateral neural folds are unelevated in the Ift122 mutant midbrain and forebrain. (F–G’) Ift122 embryos at E9.5 compared with a WT littermate control. Top panels, side views. Bottom panels, dorsal views. Cranial closure is completed by E9.5 in WT but the midbrain and forebrain neural folds are unelevated in Ift122 mutants. Dashed lines indicate the lateral neural plate borders.
Figure 4—figure supplement 3. Disrupted cranial architecture in Ift122 mutants.

Figure 4—figure supplement 3.

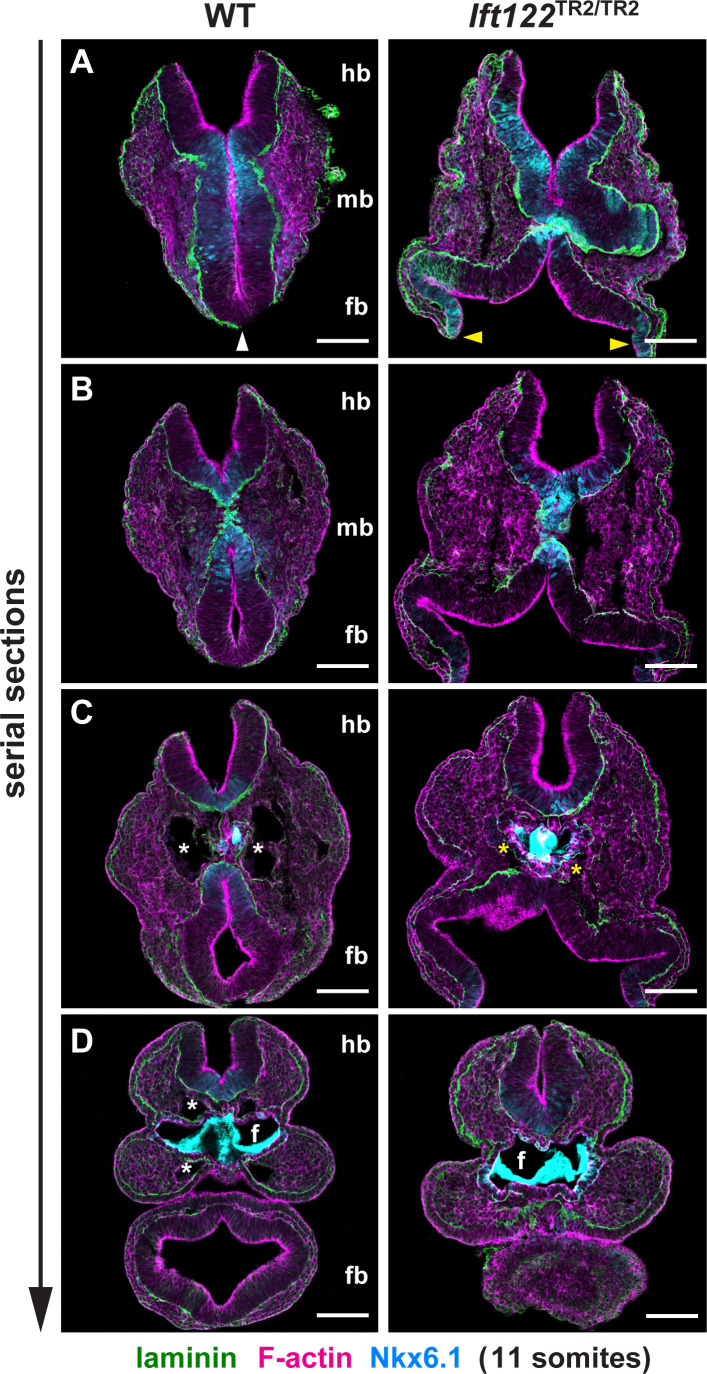
(A–D) Serial transverse sections through a wild-type littermate control (WT) and an Ift122 mutant embryo at 11 somites. Phalloidin and laminin label the apical and basal surfaces of the neuroepithelium, respectively. Nkx6.1 labels ventral cells. In WT, the forebrain (fb, white arrowhead in top panel) is closed and the midbrain (mb) displays substantial neural fold elevation. In contrast, the Ift122 mutant shows a failure of forebrain closure (yellow arrowheads in top panel). Asterisks indicate the connection between the dorsal aorta and the first brachial arch artery. Nkx6.1 signal in the foregut pocket (f) is nonspecific trapping of secondary antibody. Bars, 100 μm.
Figure 4—figure supplement 4. Analysis of mediolateral cell orientation in Ift122 and Ttc21b mutants.

Figure 4—figure supplement 4.

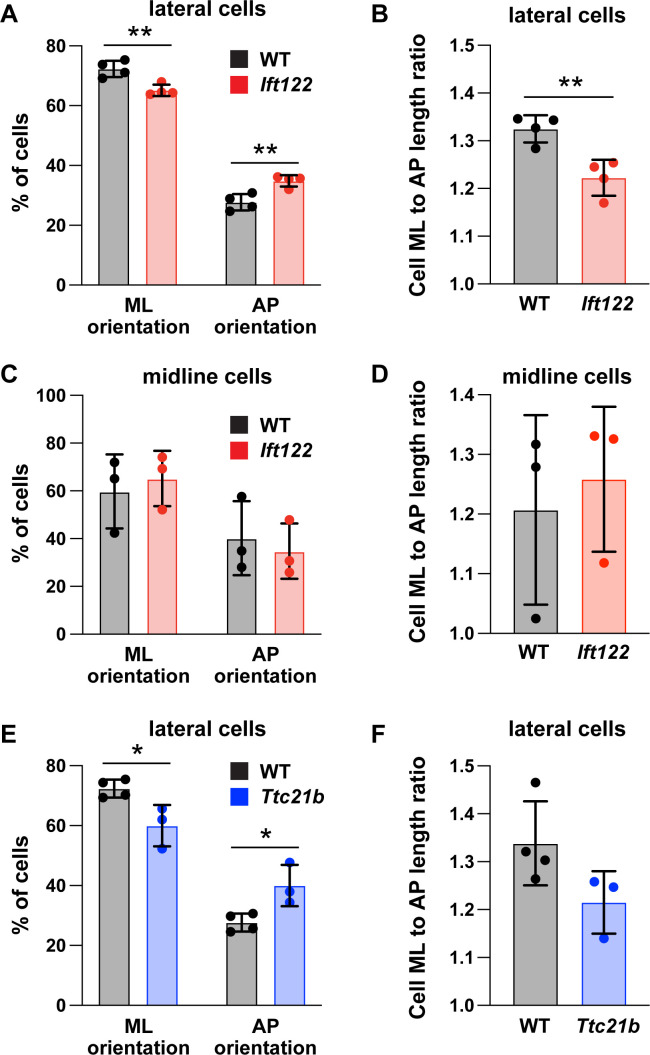
(A,C) Percentage of lateral cells (A) and midline cells (C) with a mediolateral (ML) orientation (0–45° relative to the ML axis) or an anterior-posterior (AP) orientation (45–90° relative to the ML axis) in Ift122 mutants and wild-type littermate controls (WT). (B,D) Average ratio of cell length along the ML and AP axes. (E) Percentage of lateral cells with an ML or AP orientation in Ttc21b mutants and WT littermate controls. (F) Average ratio of cell length along the ML and AP axes. Midline cells could not be analyzed due to deep midline folds in Ttc21b mutants. A single value was obtained for each embryo and the mean ± SD between embryos is shown. n = 3–4 embryos/genotype, *p<0.05, **p<0.01, two-way ANOVA test (A,C,E) or Welch’s t-test (B,D,F). See Supplementary file 1 for n and p values.
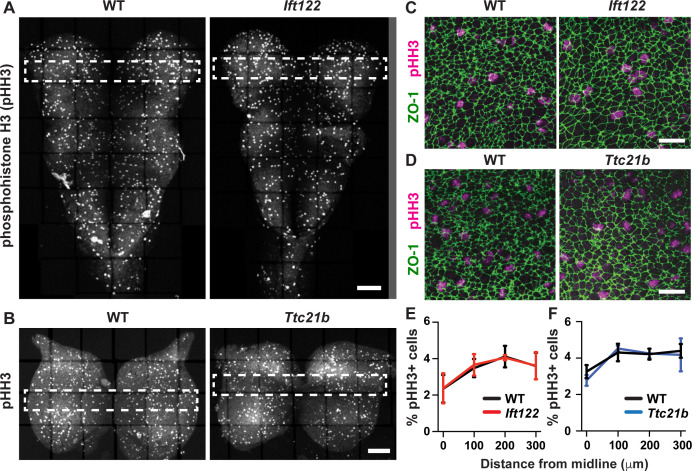
Figure 4—figure supplement 5. Cell proliferation is not affected in Ift122 and Ttc21b mutants.

Figure 4—figure supplement 5.

(A) Images of the cranial neuroepithelium from the midbrain at the level of the cranial flexure (top) to the closed hindbrain (bottom) in a wild-type littermate control (WT) and an Ift122 mutant. Dividing cells are labeled with phospho-histone H3 (pHH3), which labels cells in M phase. Dashed rectangles indicate regions analyzed in (E). (B) Projections of the cranial neuroepithelium from the forebrain-midbrain border (top) to the midbrain-hindbrain border (bottom) showing M-phase cells labeled with pHH3. Dashed rectangles indicate regions analyzed in (F). (C,D) Lateral cells in Ift122 (C) and Ttc21b (D) mutants and littermate controls labeled with pHH3 and ZO-1. (E,F) The percentage of proliferative (pHH3+) cells in 100 μm x 100 μm regions plotted by distance from the midline. Each bin is plotted at the minimum distance for that bin. A single value was obtained for each embryo and the mean ± SD between embryos is shown, n = 3 embryos/genotype. No significant differences were observed between mutant embryos and WT controls (two-way ANOVA test). See Supplementary file 1 for n and p values. Anterior up. Bars, 100 μm (A,B), 20 μm (C,D).
Figure 4—figure supplement 6. Mesenchymal cell density is not affected in Ttc21b mutants.

Figure 4—figure supplement 6.

(A) Cell nuclei visualized with DAPI in the plane of the mesenchymal cells underlying the cranial neural plate from transverse sections of individual embryos. (B) The number of mesenchymal cells per 50 μm x 100 μm region is plotted for Ttc21b mutants and wild-type littermate controls (WT). A single value was obtained for each embryo and the mean ± SD between embryos is shown, n = 3 embryos/genotype, Welch’s t-test. No significant differences between genotypes were observed. See Supplementary file 1 for n and p values. Apical up. Bar, 20 μm.