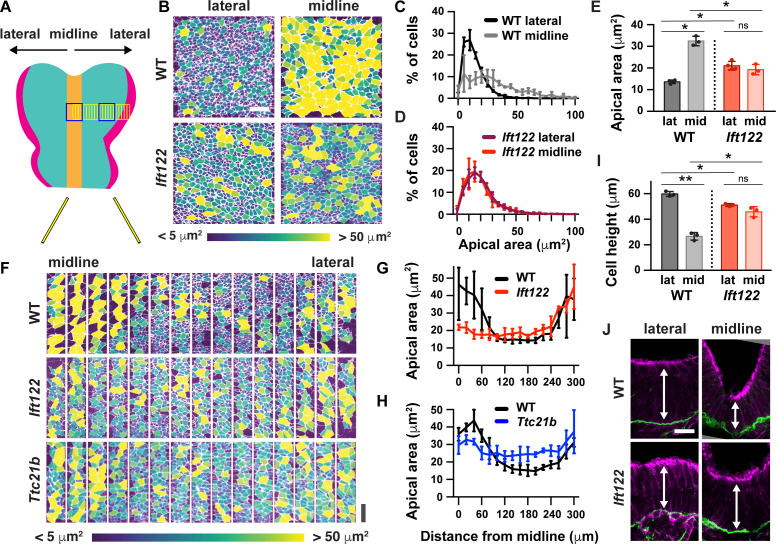
Figure 5. IFT-A mutants display a failure of patterned apical remodeling.
(A) Schematic of midbrain regions analyzed in (B) (blue boxes) and (F) (yellow boxes). (B) Lateral and midline cells labeled with ZO1 are color-coded by apical area in wild-type littermate control (WT) and Ift122 mutant embryos. (C–E) Apical area distributions (C,D) and average apical cell area (E). Lateral measurements are reproduced from Figure 4J. (F) Contiguous 20 μm wide regions spanning the mediolateral axis from the midline to the lateral margins of the midbrain neural plate. Cells are labeled with ZO1 and color-coded by apical area. (G,H) Apical cell area plotted by distance from the midline. (I,J) Average cell height in midline and lateral cells (I) measured in transverse sections of the cranial neural plate (J). Phalloidin and laminin show apical and basal surfaces, respectively. A single value was obtained for each embryo and the mean ± SD between embryos is shown, n = 3–4 embryos/genotype, *p<0.05, **p<0.01 (one-way ANOVA test). See Supplementary file 1 for n and p values. Embryos are anterior up, 7 somites (B–H) or apical up, 12 somites (I,J). Bars, 20 μm.


