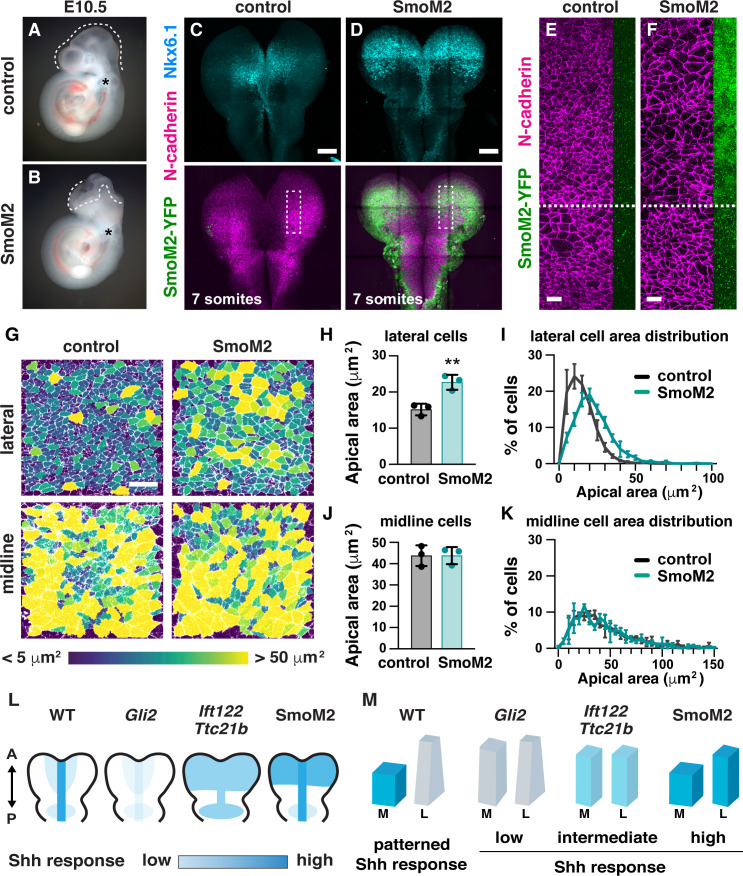
Figure 9. Ectopic Shh signaling disrupts lateral cell remodeling and causes exencephaly.
(A,B) Expression of the activated Shh receptor Smoothened (SmoM2) using the midbrain-specific Wnt1-Cre2 driver causes exencephaly (12/12 Wnt1-Cre2; SmoM2 embryos vs. 0/13 littermate controls). Control embryos were Wnt1-Cre2 or SmoM2 alone. (C,D) Wnt1-Cre2 drives SmoM2-YFP expression in the midbrain and induces ectopic Nkx6.1 expression throughout the mediolateral axis. Boxes, regions shown in (E,F). (E,F) Cells expressing SmoM2-YFP have larger apical areas compared with cells outside of the Wnt1-Cre2 expression domain (cells below the dashed line) and cells from equivalent regions in controls (E). SmoM2-YFP signal at the lateral edge of the N-cadherin region is shown. (G) Lateral and midline cells labeled with N-cadherin are color coded by area in control and SmoM2-expressing embryos. (H–K) Average apical cell area (H,J) and apical area distributions (I,K) in lateral and midline cells in control and SmoM2-expressing embryos. (L) Schematics of the pattern and intensity of the Shh response in WT, Gli2 mutant, IFT-A mutant, and SmoM2-expressing embryos. (M) Model. The different shapes of lateral and midline cells correlate with different levels of Shh signaling. A high Shh response inhibits apical remodeling and apicobasal elongation in midline cells, whereas a low Shh response allows apical constriction in lateral cells. A single value was obtained for each embryo and the mean ± SD between embryos is shown, n = 3 embryos/genotype, **p<0.01 (Welch’s t-test). See Supplementary file 1 for n and p values. Embryos are E10.5 in (A,B), 6–7 somites in (E–K). Anterior up. Bars, 100 μm in (C,D), and 20 μm in (E–G).


