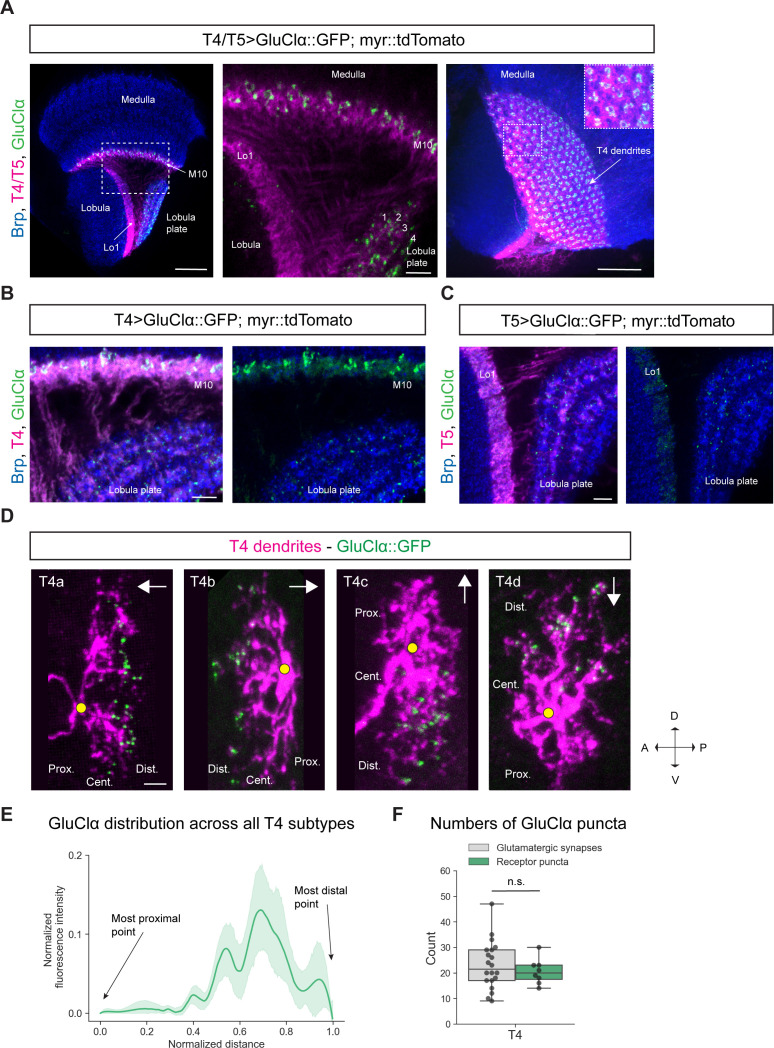
Figure 2. Subcellular localization of the inhibitory glutamate receptor GluClα in T4/T5 neurons.
(A) Optic lobe with T4/T5 neurons labeled with myr::tdTomato and GluClα::GFP. Left panel: horizontal view on the optic lobe overview (scale bar: 20 μm). Central panel: close-up of medulla layer M10, lobula layer Lo1 and lobula plate layers 1–4 (scale bar: 5 μm). Right panel: Frontal view on medulla layer M10 with T4 dendrites (scale bar: 20 μm); inset: close-up of columnar GluClα::GFP structure in layer 10 of the medulla. (B) Close-up of T4 dendrites in layer 10 of the medulla and axon terminals in lobula plate labeled with myr::tdTomato and GluClα::GFP (scale bar: 5 μm). (C) Close-up of T5 dendrites in layer 1 of the lobula and axon terminals in lobula plate labeled with myr::tdTomato and GluClα::GFP (scale bar: 5 μm). (D) Individual T4 dendrites labeled with tdTomtato and GluClα::GFP; subtypes a-d pointing in their natural orientation in visual space coordinates (A = anterior, p=posterior, D = dorsal, V = ventral). White arrows indicate preferred directions for every subtype and the dendrites’ proximal (Prox.), central (Cent.) and distal (Dist.) areas are labeled (scale bar: 2 μm). Yellow circle labels first branching point of the dendrite. (E) Quantification of GluClα distribution over the whole dendritic length (normalized distance) averaged across several T4 dendrites from all subtypes (n = 8). All dendrites were aligned pointing to the right with the most proximal point at 0.0 and the most distal point at 1.0. (F) Quantification of GluClα puncta averaged across several T4 dendrites from all subtypes (mean ± SD = 20.5, 4.98 [n = 8]) (same cells used in E) compared to number of glutamatergic input synapses from Mi9 (mean ± SD = 23.0, 9.34 [n = 20]) (EM numbers: personal communication, K. Shinomiya, May 2020). n.s., not significant p>0.05 (p=0.37, t-test).


