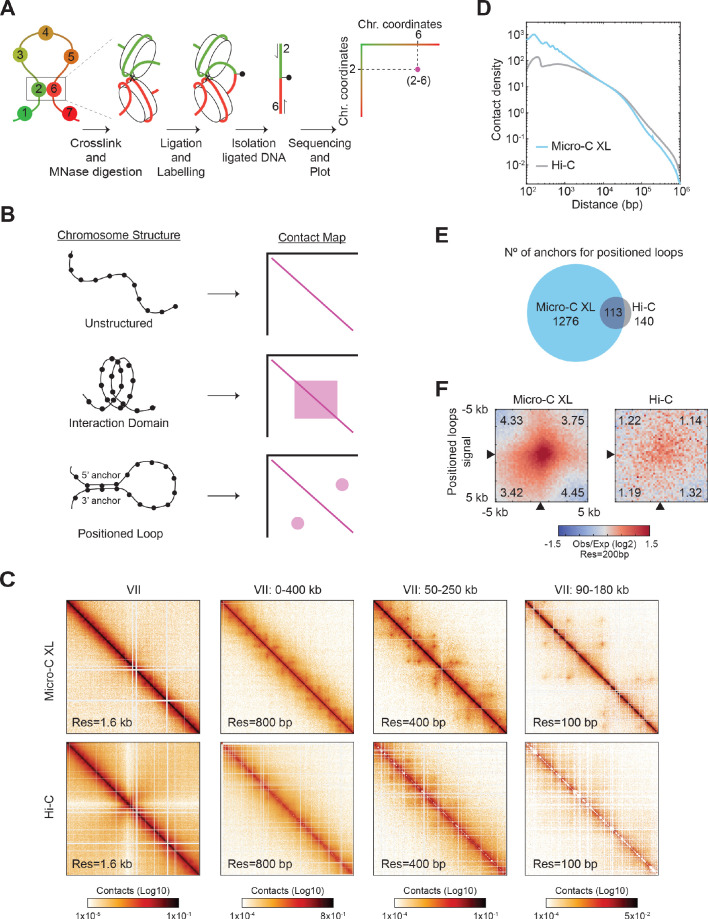
Figure 1. Micro-C XL reveals positioned loops in mitotic chromosomes.
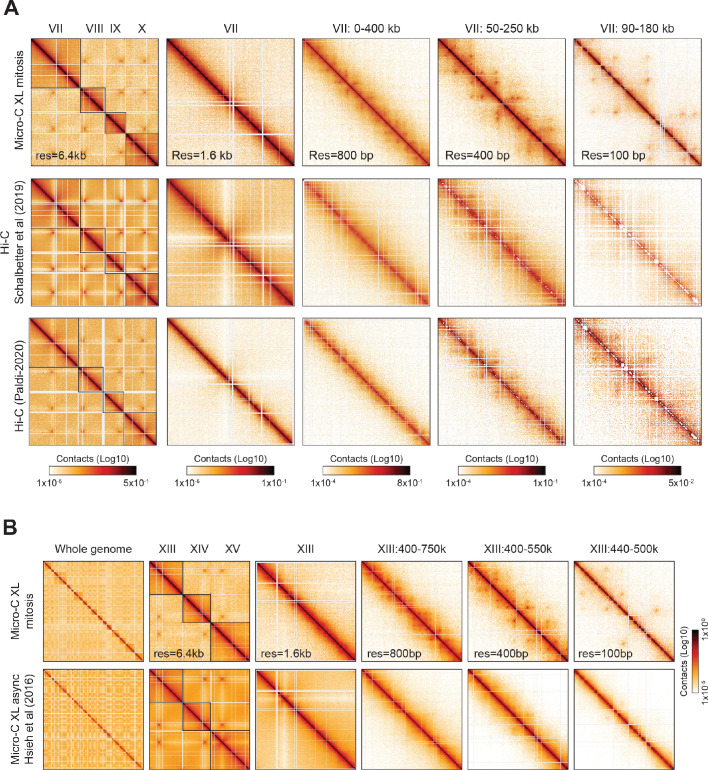
(A) Micro-C XL maps chromatin conformation by detecting nucleosomes that interact in vivo. Schematic illustrates how two interacting nucleosomes (e.g. 2 and 6) are visualized on the contact map. (B) Illustration of different chromosomal structures and their corresponding signal on the contact map. Unstructured chromosomes: only neighboring nucleosomes will be crosslinked, producing a linear signal along the diagonal. Interaction Domain: the nucleosomes within a domain will be also crosslinked, forming a square along the diagonal. Positioned loop: the nucleosomes at the base of the loop (5’ and 3’ anchors) will be crosslinked, forming a spot away from the diagonal. These different structures can form concomitantly on chromosomes producing contact maps with squares and spots along the diagonal. (C) Comparison of contact maps from mitotically arrested cells produced with Micro-C XL (top) and Hi-C (bottom) (Schalbetter et al., 2019). Contact maps show successive zoom-ins of chromosome VII (from the full 1090 kb to a 90 kb region), across multiple resolutions (from 1.6 kb to 100 bp). All contact maps throughout the manuscript have the standard colormap scheme that uses the shades of red from white (no detectable interactions) to black (maximum interactions detected) in log10 scale. (D) Micro-C XL uncovers chromatin interactions below the kilobase range. Interactions-versus-distance decaying curve shows the normalized contact density (y-axis) against the distance between the pair of crosslinked nucleosomes from 100 bp to 1 Mb (x-axis) for Micro-C XL and Hi-C (Schalbetter et al., 2019). (E) Micro-C XL detects abundant mitotic positioned loops and their corresponding loop anchors. Venn diagrams show how Micro-C identifies 1276 anchors for defined loops that include most of the loop anchors identified by Hi-C. (F) Genome-wide average heatmaps show a sharp enrichment of positioned loop signal in Micro-C XL data. Heatmaps were plotted using the 200 bp resolution data for Micro-C XL and Hi-C. The plot is a piled-up of the ±5 kb region surrounding the loop anchors (black arrows) of every loop identified in Micro-C XL. Numbers in the corners represent the fold-change of the signal enrichment of the center pixel over the indicated corner pixels (142 pixels). The contact map was normalized by matrix balancing and distance, using a diverging colormap with positive signal enrichment in red and negative signals in blue (gradient of normalized contact enrichment is in log2).


