. 2020 Nov 10;9:e59889. doi: 10.7554/eLife.59889

Figure 2. Mitotic positioned loops are cohesin-dependent.

(A) Cohesin peaks colocalize with the loop anchors of positioned loops. Contact map showing the interactions in the 290–400 kb region of chromosome X overlays with Mcd1p ChIP-seq tracks on top and left. The dashed lines indicate the colocalization of anchors of positioned loops and Mcd1p peaks. (B) Cohesin binding is enriched at anchors for positioned loops genome-wide. Heatmap (bottom panel) shows the enrichment of the Mcd1p ChIP-seq reads at the loop anchors genome-wide (732 rows). Pairs of loop anchors were rescaled to the same length. Genome-wide average ChIP-seq signal over the rescaled loop anchors is plotted (top panel). (C) Mcd1p peaks center on the anchors for positioned loops. Heatmaps were plotted with 200 bp resolution of contact map signal in ±4 kb regions surrounding the paired Mcd1p peaks. The contact map is colored by the contact probability with >95% in black, 90–95% in red, 50–90% in yellow, 0–50% in shades of green. The average Mcd1p peak is overlaid with contact maps and centered at the loop bases. (D) The positioned loop signal on the contact map is lost upon cohesin depletion. Contact maps for WT and MCD1-AID Micro-C data show substantial loss of loop signal over chromosome X: 200–450 kb upon Mcd1p degradation. (E) Positioned loops are gone upon Mcd1p-depletion. The bar chart shows the loop number called by the HiCCUPS program in WT (733) and MCD1-AID (5). (F) Genome-wide analysis confirms that the positioned loop signal is gone in MCD1-AID cells. Heatmaps were plotted with 200 bp resolution data for WT and MCD1-AID in ±5 kb regions surrounding the wild-type loop anchors.

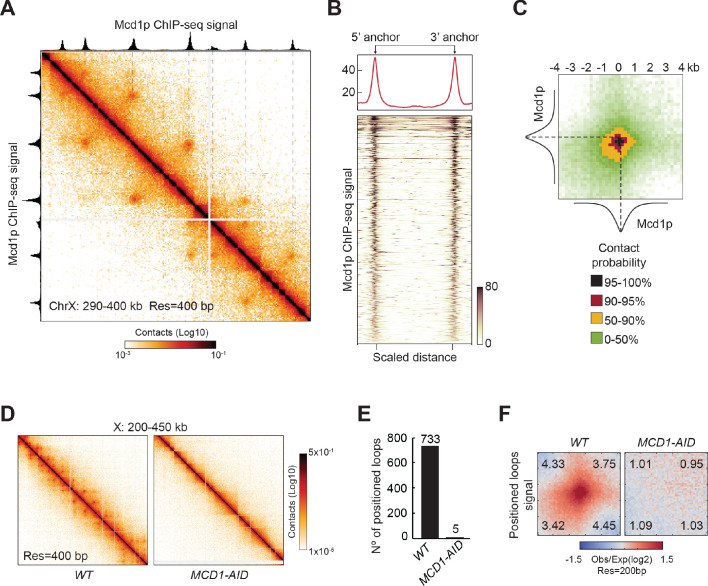
Figure 2.

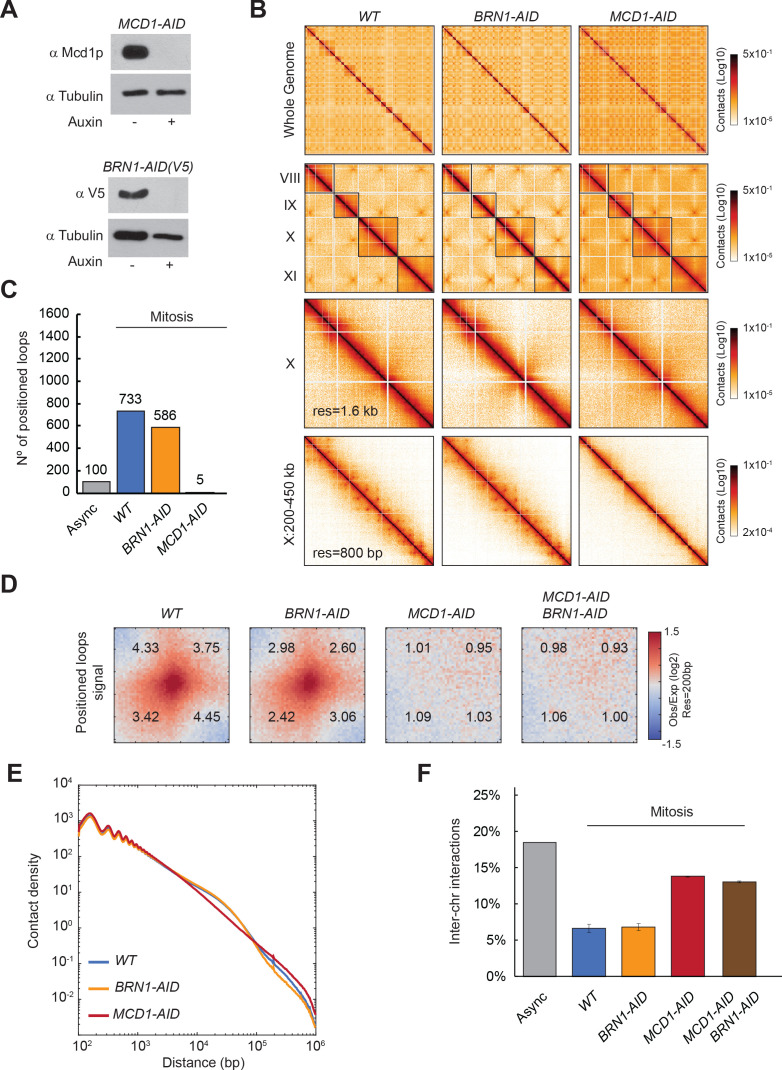
Figure 2—figure supplement 1. Mitotic loops are cohesin-dependent.

Figure 2—figure supplement 1.

(A) Cohesin and condensin are efficiently depleted upon auxin addition. The depletion of Mcd1p and Brn1p tagged with AID upon auxin addition to the media is shown by western-blot analysis. Tubulin is used for loading control. (B) The majority of the positioned loops are cohesin-dependent. Contact maps from mitotically arrested cells were produced with Micro-C XL on wild-type (WT), cohesin Mcd1p-depleted (MCD1-AID), and condensin Brn1p-depleted (BRN1-AID) cells. Contact maps show contacts between the whole genome (first row), followed by contacts from chromosomes VIII to XI at 6.4 kb resolution (second row). The following contact maps show chromosome X and a zoomed-in region (from the full 745 kb to a 250 kb region), with 1.6 kb and 800 bp resolution, respectively. Standard colormap scheme that uses the shades of red from white (no detectable interactions) to black (maximum interactions detected) in log10 scale. (C) Almost no positioned loops are detected upon cohesin depletion, while condensin depletion presents a small reduction in the number of positioned loops. Bar chart shows the loop number called by the HiCCUPS program in wild-type (WT), cohesin Mcd1p-depleted (MCD1-AID), and condensin Brn1p-depleted (BRN1-AID) cells. (D) Genome-wide analysis confirms positioned loop signal is gone in cohesin-depleted cells and slightly reduced upon depletion of condensin. Heatmaps were plotted with 200 bp resolution data for wild-type (WT), cohesin Mcd1p-depleted (MCD1-AID), and condensin Brn1p-depleted (BRN1-AID), and cohesin- and condensin-depleted (MCD1-AID BRN1-AID) cells in ±5 kb regions surrounding the wild-type anchors for positioned loops. Numbers in the corners represent the fold-change of the signal enrichment of the center pixel over the indicated corner pixels (142 pixels). The contact map was normalized by matrix balancing and distance, using a diverging colormap with positive signal enrichment in red and negative signals in blue (gradient of normalized contact enrichment is in log2). (E) Cohesin depletion shows fewer contacts in the size-region corresponding to the size of positioned loops, while condensin depletion does not. Interactions-versus-distance decaying curve shows the normalized contact density (y-axis) against the distance between the pair of crosslinked nucleosomes from 100 bp to 1 Mb (x-axis) for wild-type (WT) in blue, condensin Brn1p-depleted (BRN1-AID) in yellow, and cohesin Mcd1p-depleted (MCD1-AID) in red. (F) Cohesin depletion results in more inter-chromosomes contacts. Bar chart shows the number of inter-chromosomes contacts in wild-type asynchronous (Async), wild-type (WT), cohesin Mcd1p-depleted (MCD1-AID), condensin Brn1p-depleted (BRN1-AID), and cohesin- and condensindepleted (MCD1-AID BRN1-AID) all arrested in mitosis.
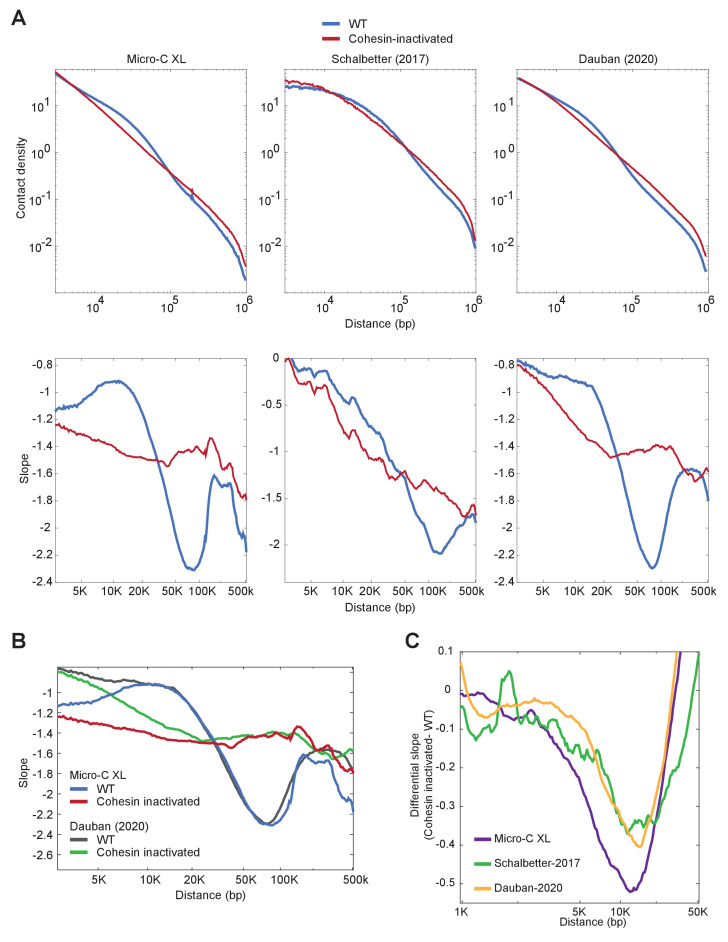
Figure 2—figure supplement 2. Comparison of chromosome contacts upon cohesin depletion of Micro-C XL versus Hi-C.

Figure 2—figure supplement 2.

(A) Micro-C detects more cohesin-dependent chromosome contacts with a smaller size-range than Hi-C. Interactions-versus-distance decaying curve shows the normalized contact density (y-axis) against the distance between the pair of crosslinked chromosomal loci from 3 kb to 1 mb (x-axis) for wild-type arrested in mitosis (WT in blue), and cohesin-inactivated cells arrested in mitosis (cohesin-inactivated in red) in our Micro-C XL, Hi-C in Schalbetter et al., 2017, and Hi-C in Dauban et al., 2020 (top). Plot of the variation of the slope in the interactions-versus-distance decaying curve for the same datasets (bottom). (B) Comparison of the plots of the variation of the slope in the interactions-versus-distance decaying curve for our Micro-C XL in wild-type (WT in blue) and without cohesin (cohesin-inactivated in red), and Hi-C in Dauban et al., 2020 in wild-type (WT in grey) and without cohesin (cohesin-inactivated in green). (C) Differential slopes of contact decay curves between cohesin inactivation and wild-type. Differential slopes were obtained by the subtraction of the slopes of cohesin inactivation to wild-type (y-axis) across the range of 1 kb to 50 kb (x-axis), showing the data from Micro-C XL in purple, Schalbetter et al., 2017 in green, and Dauban et al., 2020 in yellow.