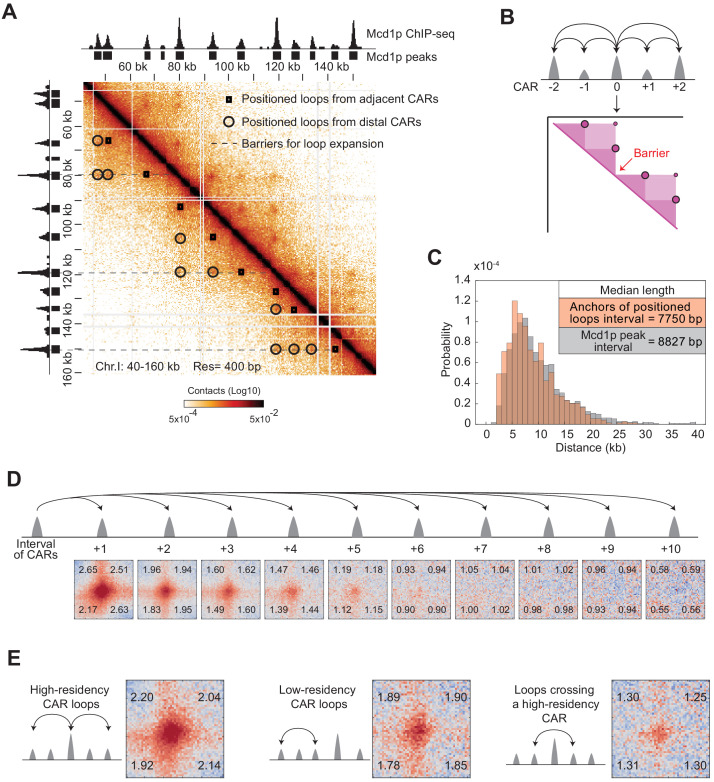
Figure 4. The organization of cohesin-dependent loops.
(A) Features of chromatin loops organization from the contact map. Contact map showing the interaction in the 40–160 kb region of chromosome I overlay with the tracks for Mcd1p ChIP-seq signal and peaks. Squares indicate loops from adjacent CARs. Circles indicate loops from distal CARs. Dashed lines indicate the position of barriers that insulate from loop expansion. (B) Model for loops organization. Each CAR (Mcd1p peak) forms a loop with the CAR that follows and a loop with the CAR that precedes (Bidirectional loops from adjacent CARs). Some CAR can form loops with distal peaks (CAR0 with CAR+2, and CAR0 with CAR-2) (loop expansion). The high-residency CAR (peaks with the highest Mcd1p signal) are barriers to loop expansion. (C) The distribution of the size of positioned loops is correlated to the cohesin peak interval. The histogram shows the probability of the length distribution for positioned loop size and Mcd1p peak interval in the range from 0 to 40 kb. The inset table highlights the median length. (D) The positioned loop signal is detected till the +5 CARs interval genome-wide. Heatmaps were plotted with 200 bp resolution data for WT. A ±5 kb region surrounding each loop anchor and the corresponding CARs interval from +1 to +10. (E) The levels of cohesin binding in a loop anchor influence the strength of the corresponding loop and the ability to function as a barrier. Heatmaps were plotted with 200 bp resolution data for WT. We plotted a ±5 kb region either surrounding the high-residency CARs and the corresponding two-interval CARs (first panel); or surrounding the low-intensity CARs and the corresponding two-interval CARs (second panel); or surrounding a CAR and the corresponding two-interval CAR with a high-residency CAR in the middle (third panel).


