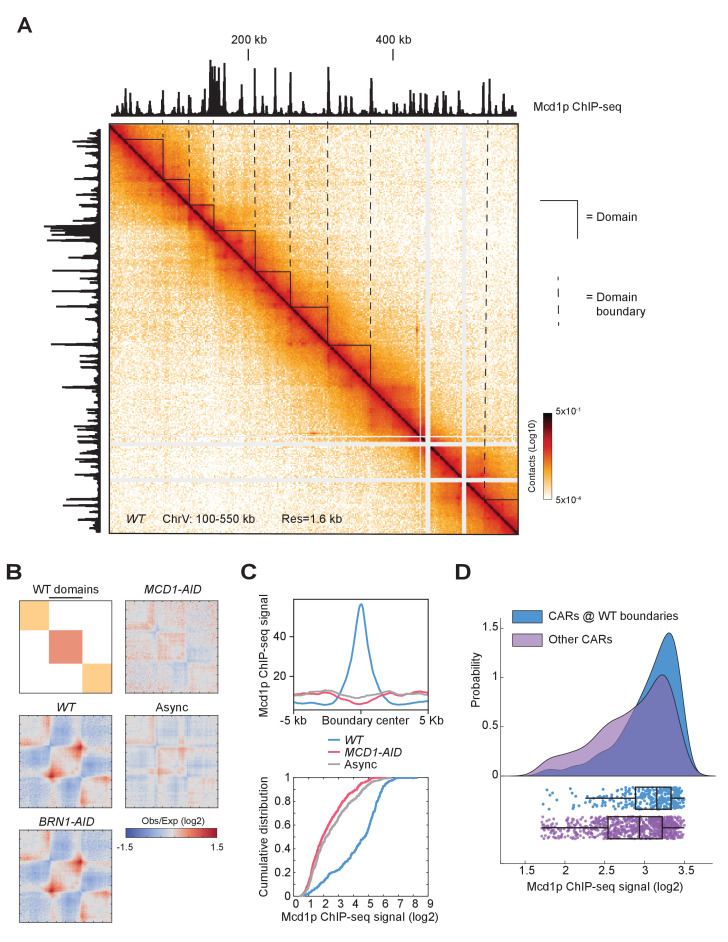
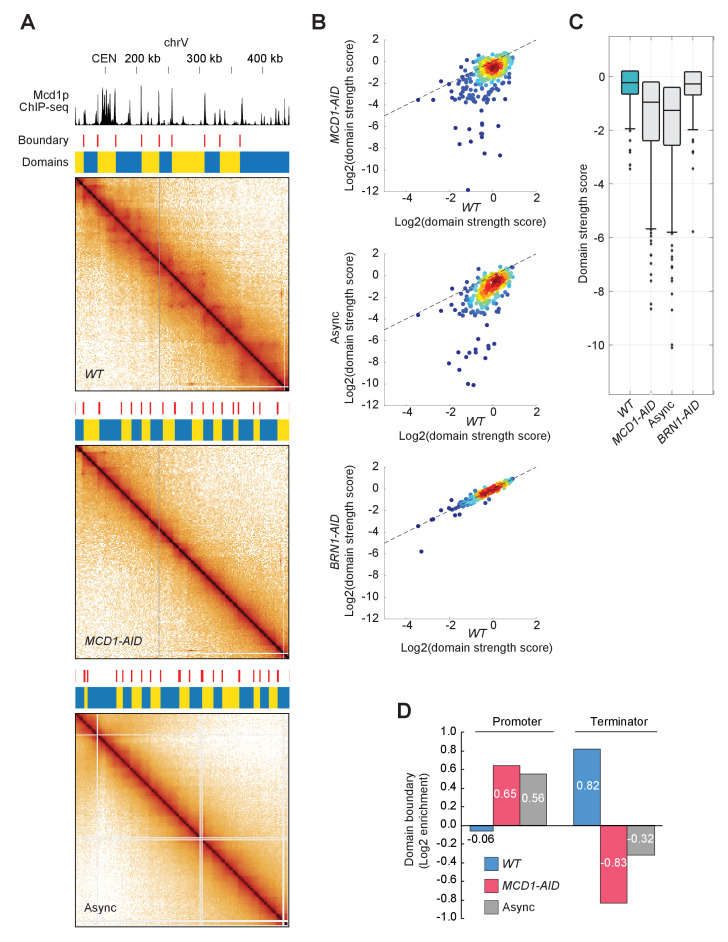
Figure 7. Cohesin depletion alters the domain landscape.
(A) Contact map of mitotic chromatin in wild-type cells reveals the presence of CAR domains and their boundaries. Contact map showing the interaction in the 100–550 kb region of chromosome V overlays with the tracks for Mcd1p ChIP-seq signal. Triangles indicate the CAR domains’ position. Dashed lines indicate the position of the CAR domain boundaries. (B) The signal composing CAR domains in wild-type is lost upon cohesin depletion. The wild-type (WT) domains are rescaled to the same length with left and right boundaries aligned on the plot (black bar). Genome-wide average domain/boundary strength for WT, BRN1-AID, MCD1-AID, and asynchronous cells were plotted as distance-normalized matrices over the CAR domains called in the wild-type (n = 306). (C) Cohesin is enriched at the boundaries of CAR domains in wild-type, but not at domains formed upon cohesin depletion. Mcd1p ChIP-seq data from wild-type cells were plotted separately over ±5 kb region (top) and cumulative curves were plotted separately as the function of log2 ratio of Mcd1p ChIP-seq signal (bottom) around the boundaries of CAR domains in wild-type (WT) (blue), the boundaries present upon Mcd1p-depletion (pink), or the boundaries present in asynchronous cells (grey). (D) CARs at wild-type domain boundaries have higher levels of cohesin binding than other CARs genome-wide. Cumulative curves show the probability distribution of Mcd1p ChIP-seq signal (log2) from CARs present at the wild-type CAR boundaries (WT) (blue), and from the other CARs (purple). Below the curves are plotted the corresponding Mcd1p ChIP-seq values of each CAR (blue dots for CARs at the CAR boundaries and purple dots for the other CARs). Box and whiskers plot indicates the median values and the quartiles distribution.


