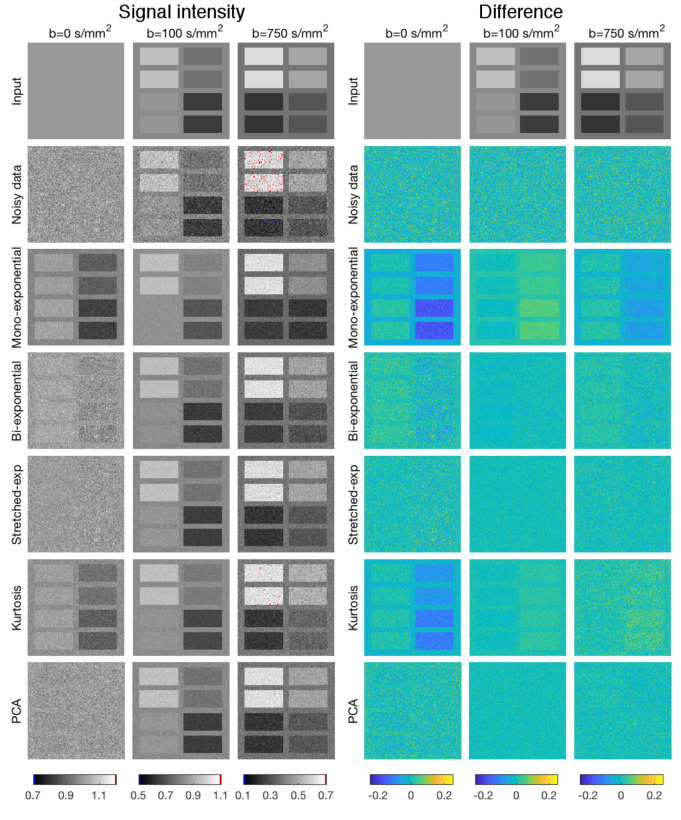
Figure 3.
Left panel: Simulated stretched-exponential images with SNR = 20, showing b = 0, 100 and 750 s mm−2 (left to right), noisy data; mono-exponential, bi-exponential, stretched-exponential and kurtosis synthetic MRI; and PCA-denoising (top to bottom). Voxels with values outside the grey level range are red (upper limit) and blue (lower limit). Right panel: Difference in signal between the input and the denoised images, similar layout to the left panel. Mono-exponential and bi-exponential synthetic MRI introduced systematic errors for some, or all b-values, which resulted in some sub-panels appearing above the noise in the difference image. Testing panel configuration based on While (2017).

