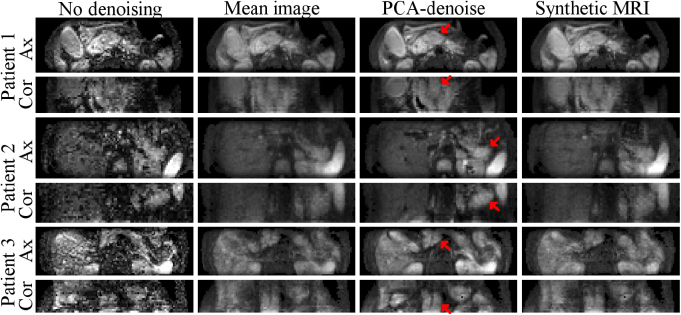
Figure 7.
Axial slices and coronal reconstructions of the b = 600 s mm−2 image from pancreatic cancer patients after PCA-denoising (3rd column) compared to the original data (1st column), averaging (2nd column) and bi-exponential synthetic MRI (4th column). Red arrows indicate tumour locations. Compared to PCA-denoising, the other approaches blur the image (mainly visible in the coronal reconstruction), preventing accurate boundary detection.

