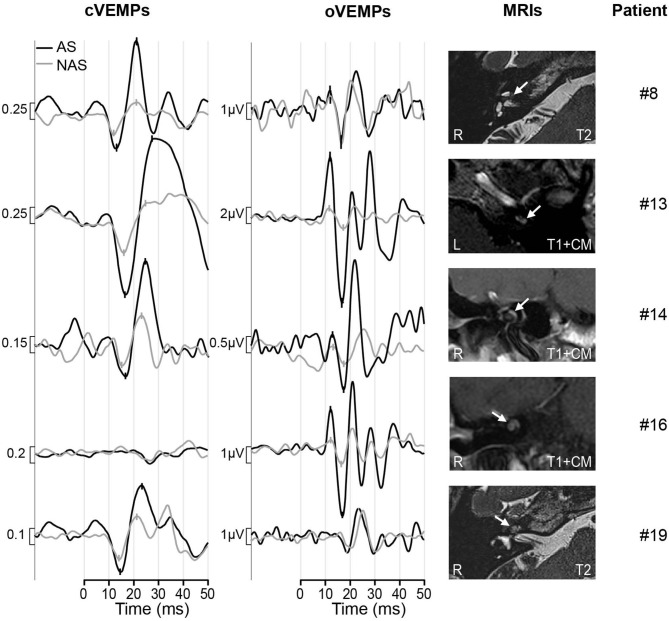
Figure 2.
Results of patients with enhanced VEMPs. The black trace shows the response of the affected side (AS), the response from the non-affected side (NAS) is shown by the gray line. The p13, n23 peaks for cVEMPs and n10, p15 peaks for oVEMPs are marked. The MRI scans are shown in the right column with the tumors marked by white arrows. Patient #8, #13, #19: axial, Patient #14 and #16: coronal; R, right; L, left; T1+CM, t1-weighted with contrast medium; T2, t2-weighted.

