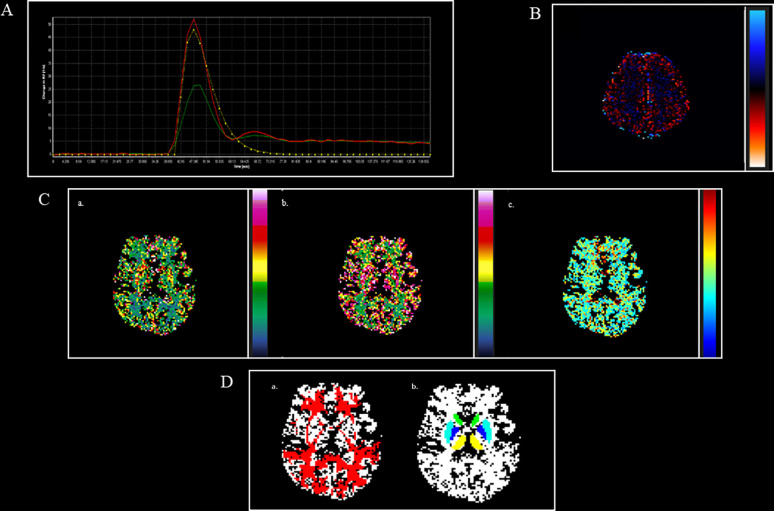
Figure 4.
DSC perfusion maps and their overlap with structural masks in an MS patient. (A). AIF curve created by using global, automatic, and outside-artery technique (B). Leakage map, obtained through the leakage correction function, to minimize leakage effect both on Gadolinium and no Gadolinium enhancing lesions (C). a. CBV map; b. CBF map; c. MTT map. (D). a. NAWM (red), obtained by subtracting from white matter (WM binary) masks the different types of lesions, linearly registered to CBV map; b. thalamus (yellow), caudate (green), putamen (light blue), globus pallidus (blue), obtained by using FIRST software, linearly registered to CBV map. AIF, arterial input function; CBV, cerebral blood volume; CBF, cerebral blood flow; MTT, mean transit time; NAWM, normal appearing white matter.

