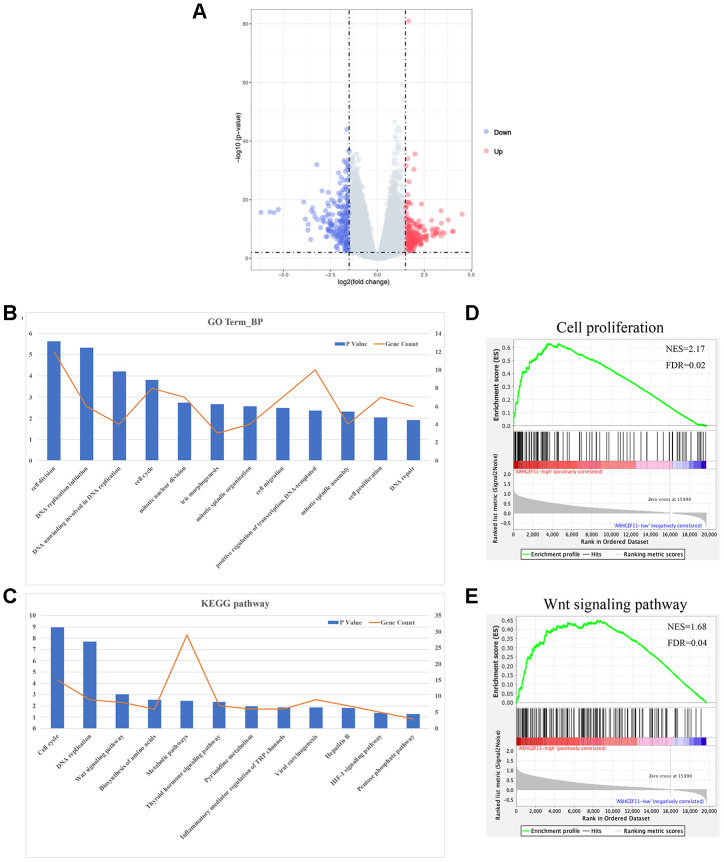
Figure 4.
Functional annotation and pathway enrichment analysis for ARHGEF11. (A) Volcano plot of DEGs between ARHGEF11-high and ARHGEF11-low patients. (B) GO analysis of biological process (BP) using DAVID. (C) KEGG pathway analysis using DAVID. (D and E) GSEA analysis as a validation for the DAVID analysis.

