Figure 1.

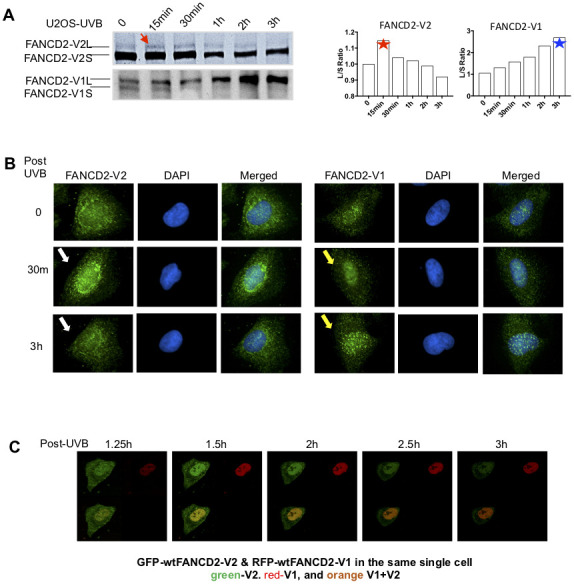
The peak activation of FANCD2-V2 is earlier than FANCD2-V1 in cells treated with UVB. (A) The peak level of monoubiquitinated FANCD2-V2 showed at an earlier time point comparing to FANCD2-V2. U2OS cells were treated with UVB (25J/m2) and collected at the time points indicated in the Figure. Nuclear extractions were subsequently prepared for western blotting of FANCD2-V1 or-V2 proteins through using specific antibodies recognizing V1 or V2 respectively. The relative ratio L/S of monoubiquitinated FANCD2 (L-form) over non-monoubiquitinated FANCD2 (S-form) was shown in the right to indicate different kinetics between the two forms of FANCD2 activation (the ratios of FANCD2-V2 L/S were normalized by the ratio at time 0, considered as 1). (B) Focus formation of FANCD2-V2 is earlier than FANCD2-V1. U2OS cells were treated by UVB (25J/m2) and collected after 30min or 3h, then together with untreated cells were prepared for immunofluorescent studies. Anti-FANCD2-V1 or anti-FANCD2-V1 specific antibodies were used for the primary incubation. The anti-Rabbit-Alexa 488 (green) was used for the secondary incubation. DAPI was used for the nuclear stain. Focus formation of FANCD2-V2 can be shown clearly at 30min after UVB-treatment and vanished at 3h, but FANCD2-V1 foci were not clearly shown until 3h tested. (C) The peak intensity of FANCD2-V2 in the nucleus of a live cell is earlier than FANCD2-V1. The live imaging on cells transfected with both GFP-FANCD2-V2 and RFP-FANCD2-V1 was conducted by taking photos every 30min post UVB-treatment (25J/m2). Owing to the time needed to set up, the earliest image was only available at time 1h 15min post treatment (Supplementary Video 1). The earlier fluorescence peak was further supported by the relative cell fluorescence (Supplementary Figure 1C, the bottom panel), which shows green-fluorescence was dominantly shown in cell nucleus in the early time points in UV-treated cells.
