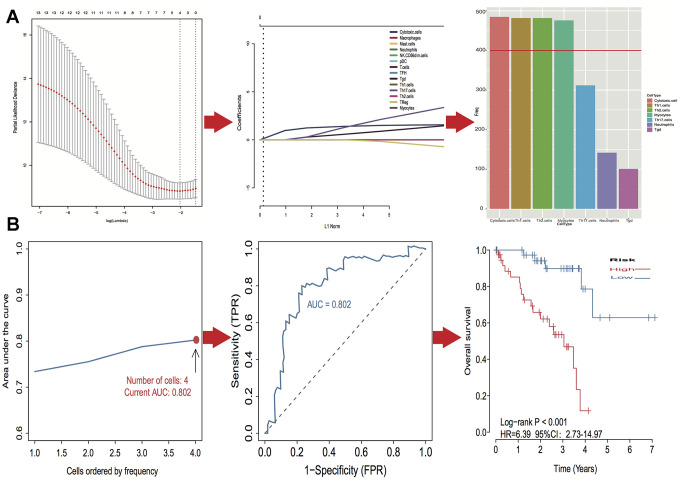
Figure 4.
Identification of optimal cell signature for overall survival (OS) prediction. (A) The process of building the signature containing four cell types (3 immune cells and 1 stromal cell) and the coefficients calculated using the lasso method: from 500 iterations of lasso-penalized multivariate modeling, four cell types were reported as optimal for survival prediction more than 400 times; (B) The AUC curves of cell type models and Kaplan–Meier survival analysis of four-cell-type model in TCGA. Then the number of cells is four, the value of AUC is the highest (0.802). Kaplan–Meier curves indicated that there is a significant difference between high- and low-risk groups (log-rank P < 0.001).

