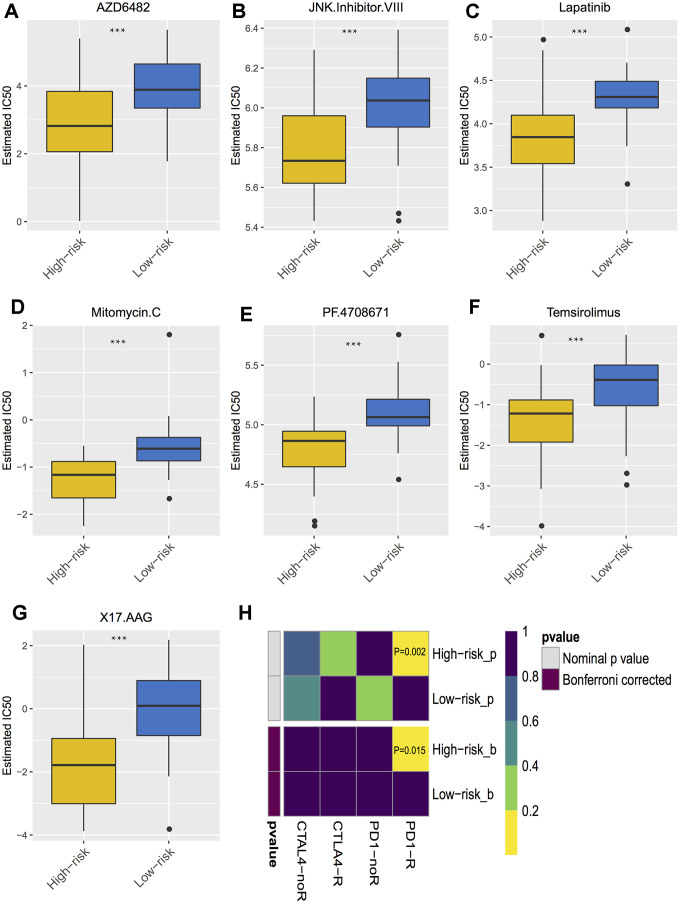
Figure 8.
Differential putative chemotherapeutic and immunotherapeutic response. (A–G) The box plots of the estimated IC50 for the most sensitive chemotherapeutic drugs. (H) Submap analysis manifested that high risk group could be more sensitive to the programmed cell death protein 1 inhibitor (Bonferroni-corrected P = 0.02). *** P < 0.001.

