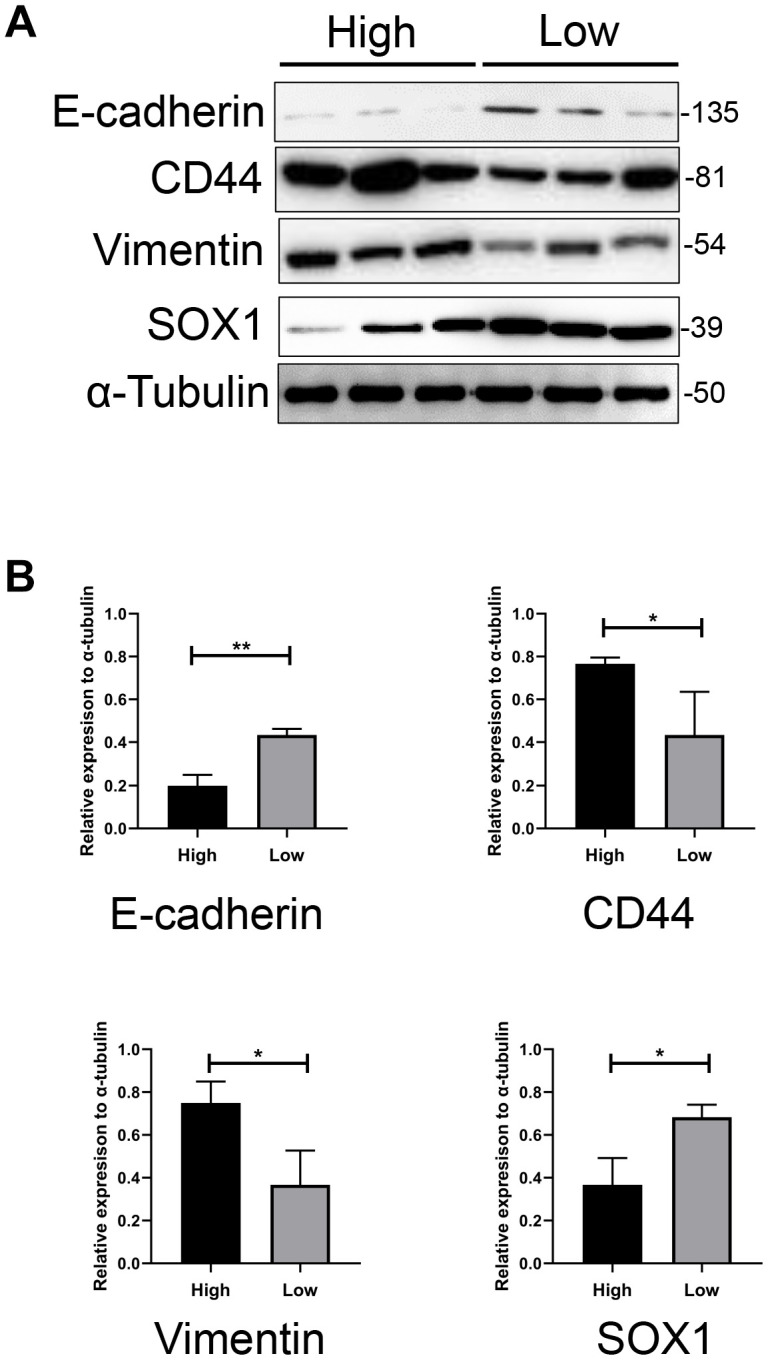
Figure 5.

The expression pattern of mesenchymal and epithelial markers in both groups. (A) Western blotting assay showed significantly higher expression of CD44 and Vimentin, and lower expression of Sox1 and E-cadherin in GBM cells from higher scored group than lower scored group. α-tubulin was used as internal reference. (B) Bar charts showed the relative expression of these markers to α-tubulin and revealed the statistically different expression of these markers between two groups.
