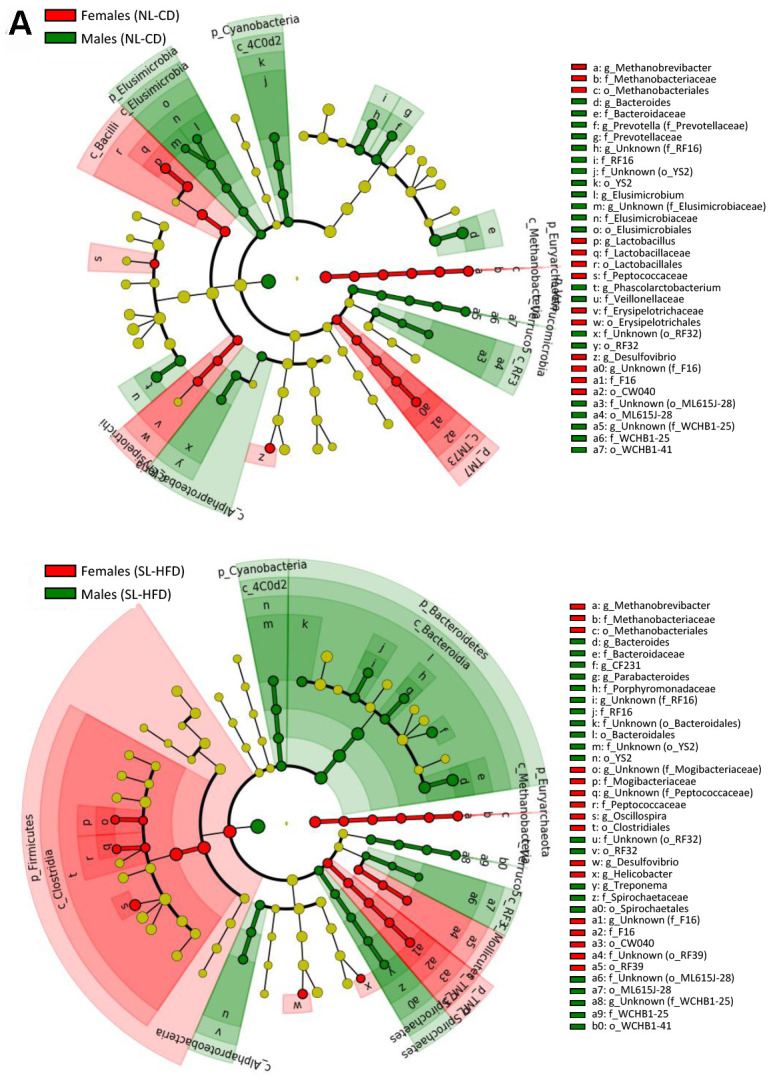
Figure 1.

LEfSe analysis between sexes under normal feeding and overfeeding conditions in intact animals (A). Cladogram representing the taxonomic hierarchical structure of the identified differences between genders using Linear discriminant analysis effect size (LEfSe). Each filled circle represents one phylotype. Red denotes bacterial taxa statistically overrepresented in females; green denotes bacterial taxa overrepresented in males. Phylum and class are indicated by their names on the cladogram and the order, family, or genus are given in the key.
