Figure 4.

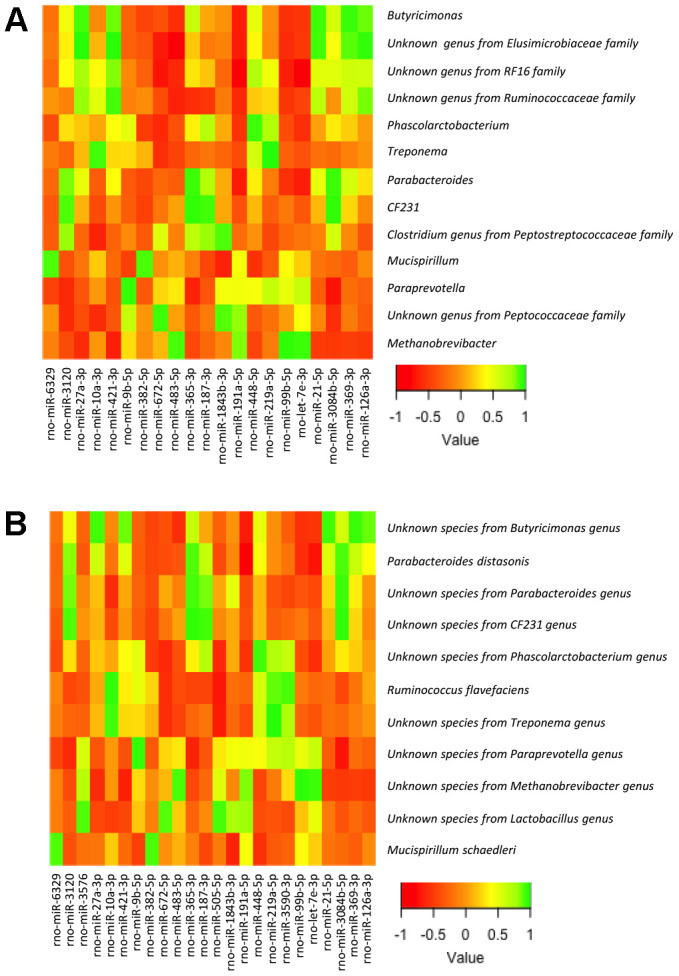
Heatmap from the Pearson’s correlation coefficient between the bacterial genera (A) and species (B) identified by LEfSe analysis and the expression levels of the miRNAs in the large intestine.

Heatmap from the Pearson’s correlation coefficient between the bacterial genera (A) and species (B) identified by LEfSe analysis and the expression levels of the miRNAs in the large intestine.