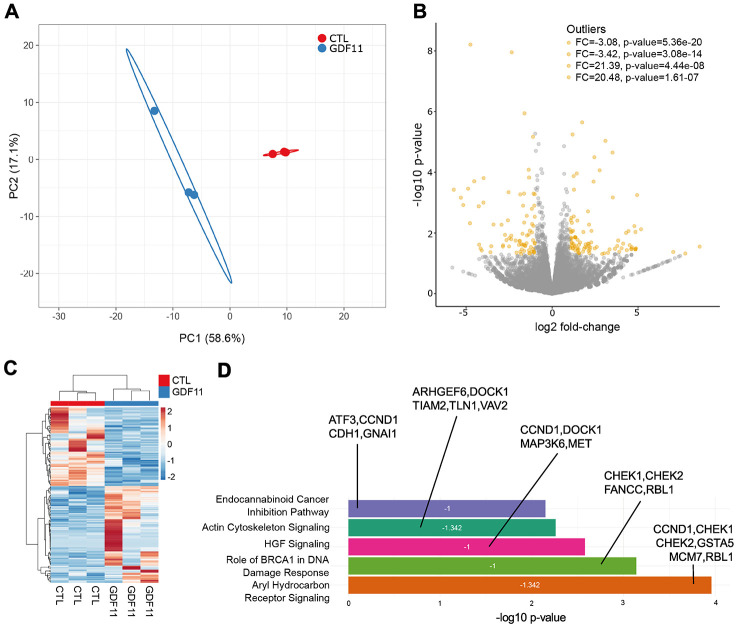
Figure 5.
Anti-fibrogenic pathways are inhibited after GDF11 treatment in the liver of ob/ob mice. (A) Principal Component Analysis applied to expression profiles of 179 genes in control and GDF11-treated livers from ob/ob mice (n=3 per group). (B) Volcano plot displaying differences in gene expression (|log2 fold-change| >2, -log10 p-value >1.3). The top 4 outliers, not in the plot, are evidenced in terms of fold change (FC) and significance (p-value). (C) Heatmap showing differences in mRNA expression levels between control and GDF11-treated ob/ob mice (n=3 per group). (D) Bar plot reporting biological pathways in crescent statistical significance order (bar length), together with the functional inhibition score of the pathways (z-score value within the bar) and the differentially expressed genes representing each pathway.

