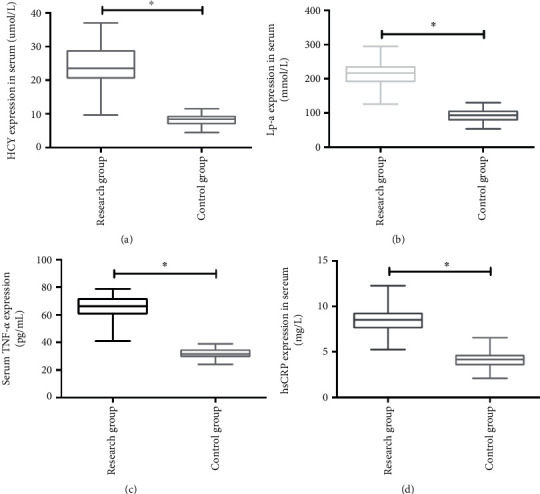
Figure 2.

Expression of HCY, Lp-a, TNF-α, and hsCRP in serum of subjects in the two groups. (a) HCY expression in the RG was significantly higher than that in the CG. (b) Lp-a expression in the RG was significantly higher than that in the CG. (c) TNF-α expression in the RG was significantly higher than that in the CG. (d) hsCRP expression in the RG was significantly higher than that in the CG. ∗ indicates p < 0.05.
