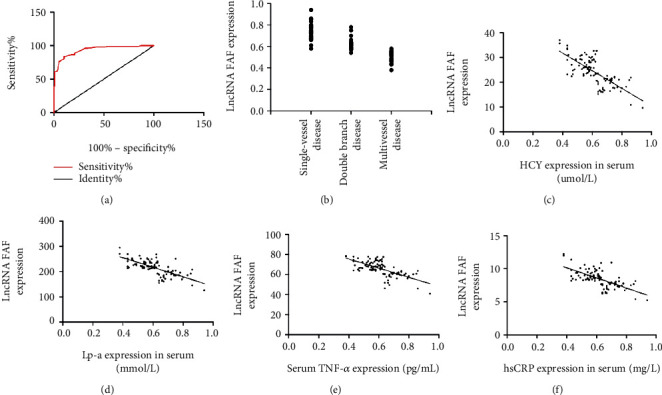
Figure 3.

Diagnostic value and correlation analysis of FAF for coronary heart disease. (a) ROC analysis of FAF in the diagnosis of coronary heart disease. (b) There was a negative correlation between FAF and coronary lesion vessels in patients with coronary heart disease (r = −0.881, p < 0.001). (c) The FAF and PAF expressions were negatively correlated (r = −0.728, p < 0.001). (d) FAF and ET-1 expressions were negatively correlated (r = 0 − 704, p < 0.001). (e) FAF and TNF-α expressions were negatively correlated (r = −0.674, p < 0.05). (f) FAF and hsCRP expressions were negatively correlated (r = −0.664, p < 0.05).
