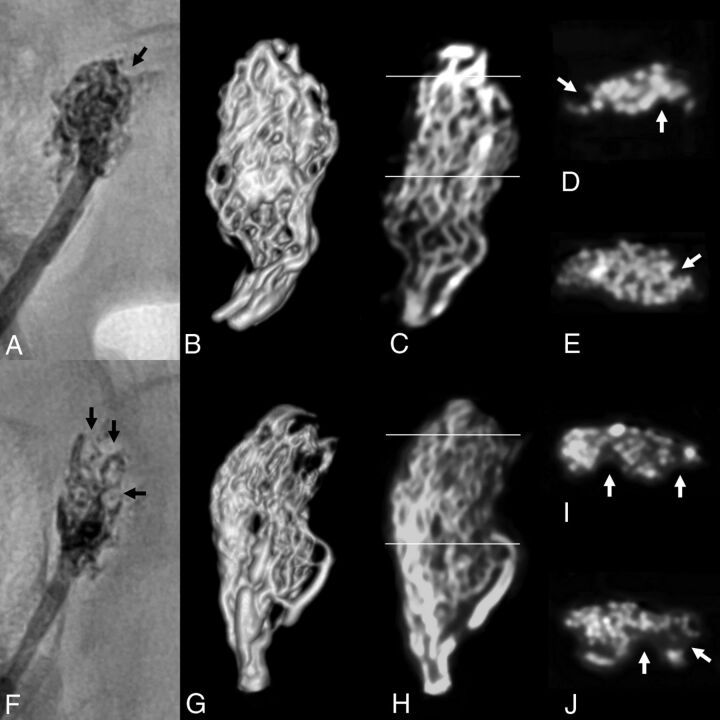
Fig 4.
Distribution of the LEA in HR-DVT. The distribution of the LEA in HR-DVT is shown for 2 representative cases. A–E, PHIL 25% LV. F–J, Standard PHIL 25%. A and F, Postinterventional x-rays. B and G, Volume-rendering of the HR-DVT dataset. C and H, Coronal HR-DVT images. D, E, I, and J, Axial HR-DVT images of the middle (E and J) and the distal (D and I) parts of the RM (lines in C and H indicate the position of the axial planes). Note the perceptibility of single blood vessels of the RM in the high-resolution HR-DVT images. Well-circumscribed filling defects were identified in the axial HR-DVT images, which were particularly detected in the distal, only partially embolized parts of the RM (white arrows). The same filling defects were also seen in the 2D x-rays (black arrows).

