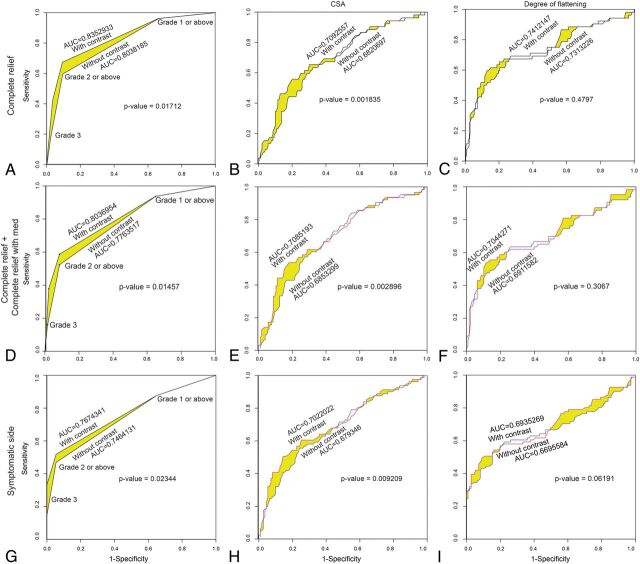
Fig 6.
Receiver operating curves assessing the performance of the grade of neurovascular conflict (A, D, and G), CSA (B, E, and H), and DOF (C, F, and I) in predicting complete relief without further need for analgesic medication (type 1 outcome) after MVD (A–C), complete relief with or without further need for analgesic medication (type 1 or 2 outcome) after MVD (D–F), and symptom side in patients with TN (G–I) for both NE-CISS and CE-CISS images, as delineated in the graphs. The area under the curve and P values comparing the NE-CISS and CE-CISS curves are provided in the individual graphs.

