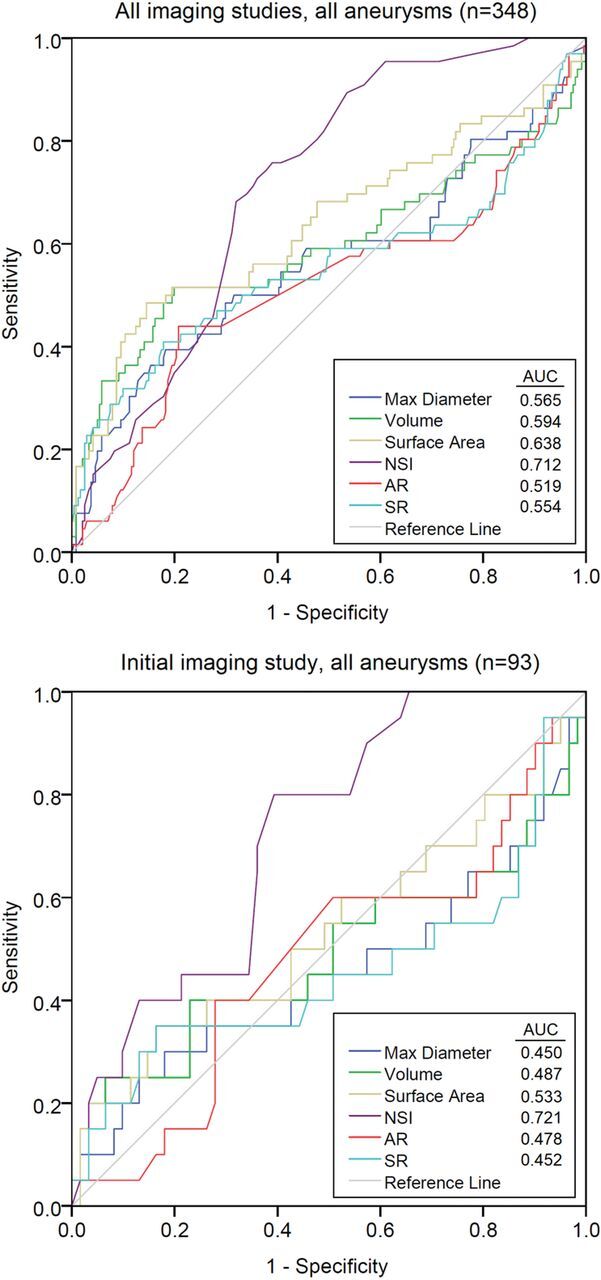
Fig 3.

Receiver operating characteristic curves for each of the indices included in the study, for all imaging studies, and the initial imaging study only. Area under the curve values are listed in the legends. The NSI provides the best discrimination between growing and stable aneurysms (area under the curve = 0.712 for all imaging studies, and area under the curve = 0.721 for the initial imaging study). AR indicates aspect ratio; SR, size ratio; max, maximum.
