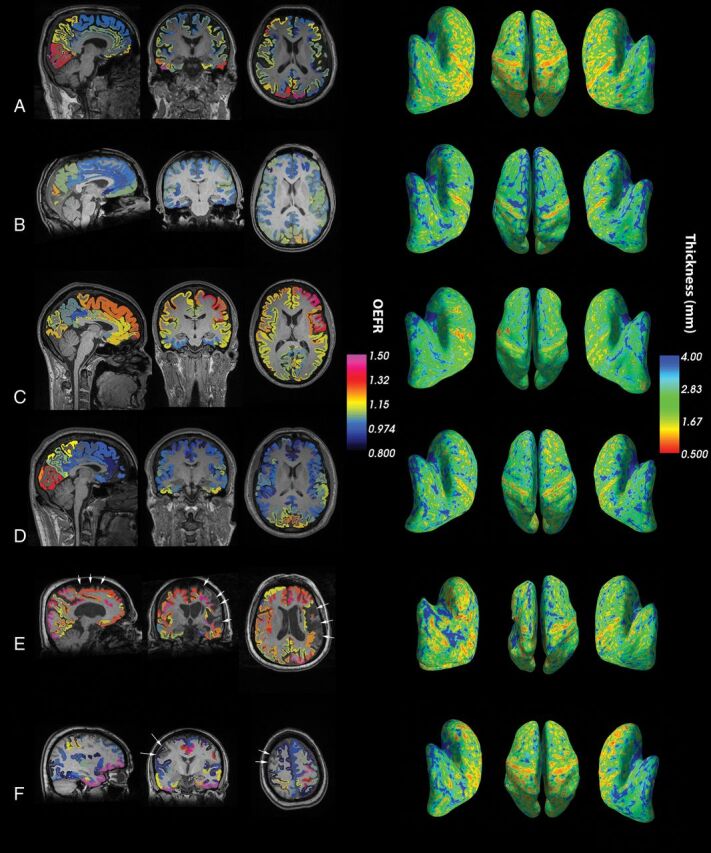
Fig 1.

Representative views of OEFRs averaged over Destrieux parcellations, T1-anatomy, and cortical thickness on inflated surface maps. A–D, Four patients without infarction or hemorrhage were selected randomly from the patient cohort for visualization. E, This patient exemplifies the rationale for excluding infarcted hemispheres. Extensive encephalomalacia distorts cortical parcellations and confounds calculations on cortical and pial anatomy by FreeSurfer (arrows). F, This patient demonstrates paradoxically decreased OEFR around a region of infarction (arrows). The validity and significance of such decreases near infarcted areas are unknown. Consequently, all hemispheres ipsilateral to infarctions or hemorrhages were excluded. Modal color maps are identical for all subfigures and views.
