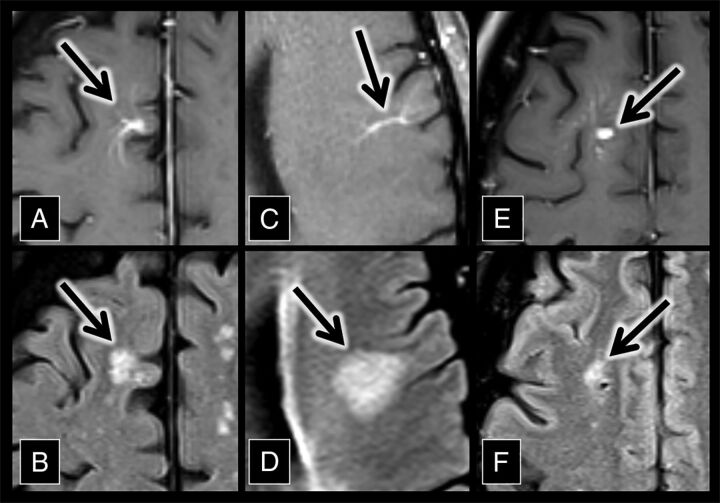
Fig 2.
Developmental venous anomaly–associated lesions in the control group. A, An axial contrast-enhanced T1 sequence shows a right frontal lobe DVA (arrow). B, An axial FLAIR sequence shows hyperintensity (arrow) adjacent to the DVA in A. C, An axial contrast-enhanced T1 sequence shows a left frontal lobe DVA (arrow). D, An axial FLAIR sequence shows hyperintensity (arrow) adjacent to the DVA in C. D, An axial contrast-enhanced T1 sequence shows a right frontal lobe DVA (arrow). F, An axial FLAIR sequence shows hyperintensity (arrow) adjacent to the DVA in E.

