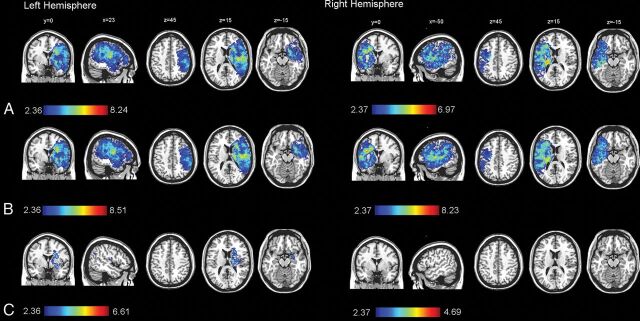
Fig 2.
Voxel-based lesion-symptom mapping of lesion impact on the modified Rankin Scale score calculated separately for each hemisphere (right side, n = 94; left side, n = 122) using no covariates (A); sex and age as covariates (B); and sex, age, and ischemic lesion volume as covariates (C). The color range indicates t-scores thresholded at a 1% false discovery rate. Higher t-scores (red) indicate areas strongly associated with functional outcome (mRS).

