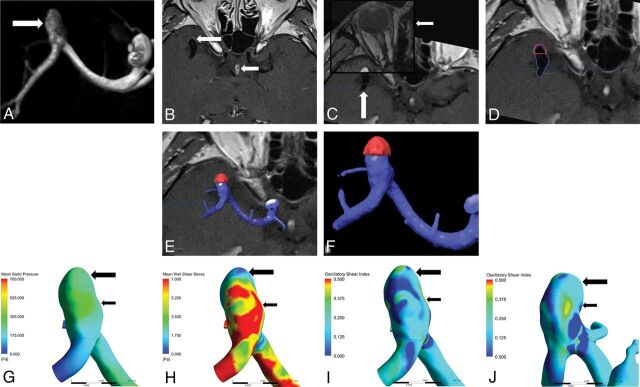
Fig 2.
A, MRA shows a middle cerebral artery bifurcation aneurysm (white arrow). B, Local enhancement on the aneurysmal wall on HR-VWI postgadolinium T1WI (large white arrow) compared with that of the pituitary infundibulum (small white arrow). C, Auto Fusion of HR-VWI T1WI (large white arrow) and TOF-MRA (small white arrow) images. D–F, Location of enhanced area (highlighted in red) on the aneurysm (displayed in blue), G, Mean static pressure distribution. H, WSS distribution. The enhanced area has lower mean WSS (large black arrow) than the nonenhanced area (small black arrow). I and J, OSI distribution. The enhanced area has lower OSI (large black arrow) than the nonenhanced area (small black arrow).

