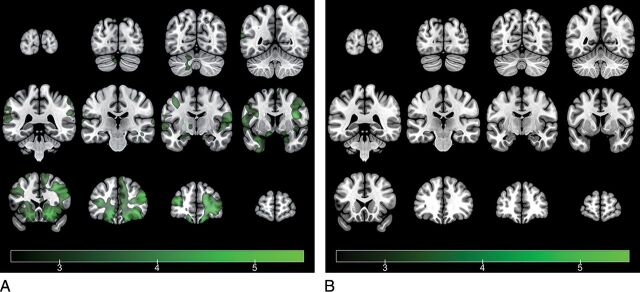
Fig 2.
Representation of average brain-activation maps of the healthy control group (A) and the traumatic anosmia group (B) in response to the β-mercaptoethanol stimuli (1-sample t test, voxelwise threshold false discovery rate–corrected P < .05) (t values in a color scale). While the healthy control group shows activation in multiple olfactory structures and other associated brain regions, the traumatic anosmia group shows no activation in response to BME stimuli. The left side of the brain is presented on the left side of the image, according to neurologic convention.

