
Fig 3.
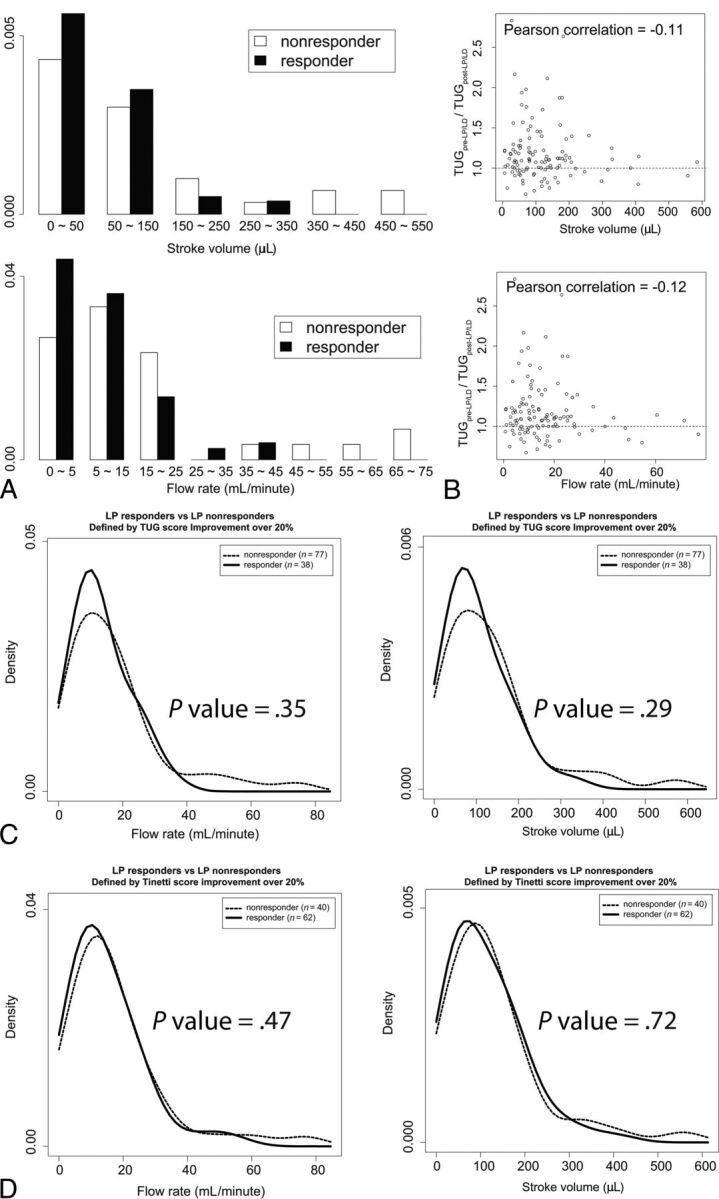
The aqueductal CSF flow and LP/LD response measured by subjective improvement and Tinetti and TUG score improvement. A, The distributions of aqueductal stroke volume (upper) and flow rate (lower) are compared between LP/LD responders and nonresponders. The aqueductal flow rate is significantly higher in LP/LD nonresponders than in responders (Wilcoxon rank sum test, P = .03 for stroke volume and .028 for flow rate). B, The aqueductal stroke volume (upper) and flow rate (lower) are plotted against the quantitative improvement of the TUG score (y-axis) after LP/LD. The Pearson correlation between the TUG score improvement and the stroke volume and flow rate are −0.113 and −0.116, respectively. C, Twenty percent or greater improvement in the TUG score after LP/LD was used to define LP/LD responders, and <20% improvement in the TUG score after LP/LD was used to define LP/LD nonresponders. The number of patients in each group is shown as a number on the graph. The 2 groups exhibit an overlapping distribution of aqueductal flow rate and stroke volumes. D, “Tinetti score deficit” is defined as the difference between a perfect Tinetti score and the patient's Tinetti score. Twenty percent or greater improvement in the Tinetti score deficit after LP/LD was used to define LP/LD responders, and < 20% improvement in the Tinetti score deficit after LP/LD was used to define LP/LD nonresponders. Again, the 2 groups exhibit overlapping distribution of aqueductal flow rate and stroke volumes.