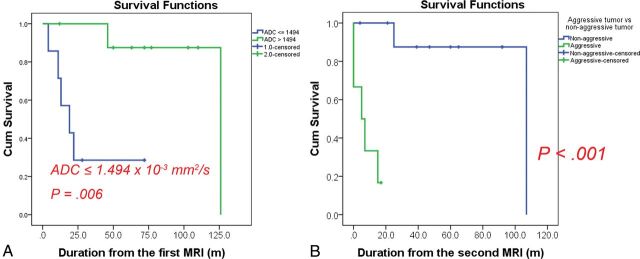
Fig 4.
Kaplan-Meier curves using log-rank tests for survival. A, Graph shows 2 groups based on a cutoff ADC of 1.494 × 10⁻³ mm2/s at the first MR imaging. The group with the lower ADC had a significantly worse prognosis (P = .006). B, Graph shows the tumor progression rate in the 2 groups at the second MR imaging. The prognosis was significantly worse in the aggressive tumor group than in the nonaggressive tumor group (P < .001). The cutoff ADC value could predict patients with a worse prognosis at the first MR imaging at a mean of 9.1 ± 5.2 months earlier than the second MR imaging. Cum indicates cumulative.

