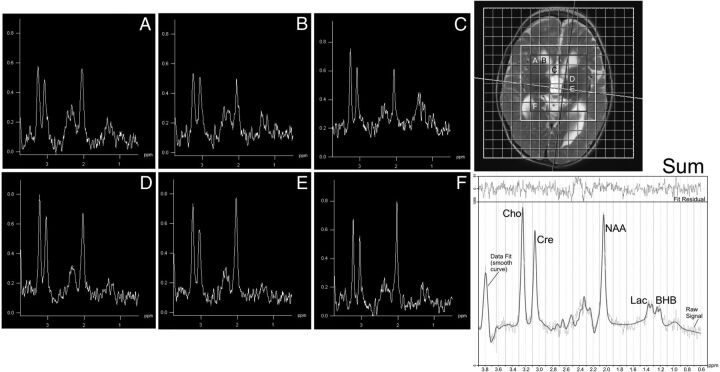
Fig 1.
Voxel-of-interest (inner 8 × 8 matrix) and masked region (7 × 7 matrix) that retained spectra based on SNR, NAA, and adequate Cramér-Rao bounds. Across the brain (spectra labeled A–F, corresponding to labeled voxels in image at the upper right), 2 peaks comprising lactate and BHB are shown at 1.33 and 1.2 ppm, respectively, with lactate more prominent in voxels containing CSF in this patient with mitochondrial cytopathy. At the lower right, the composite spectrum from the masked region is shown, with the LCModel fit overlaid.

