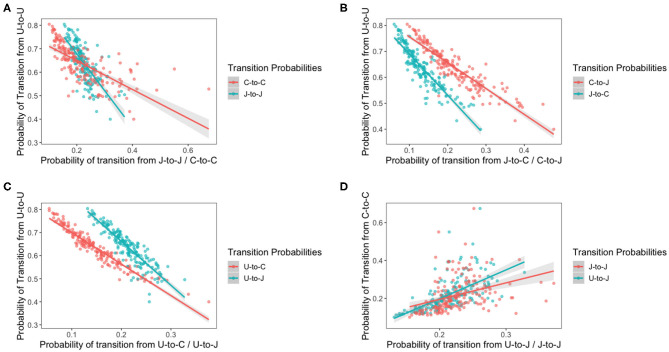
Figure 10.
Transition probabilities for a three state system. In these plots, “U” refers to being uncolonized, “J” refers to colonization by C. jejuni and “C” refers to colonization by C. coli. Each of the points is the transition probability for a specific bird within the flock. Linear regression fits are plotted with a shaded region representing the 95% confidence intervals of the regression. All regressions were statistically significant (t-test p < 0.0001). (A) The transition probabilities of J-to-J and C-to-C against the transition probability of U-to-U. (B) The transition probabilities of C-to-J and J-to-C against the transition probability of U-to-U. (C) The transition probabilities of U-to-J and U-to-C against the transition probability of U-to-U. (D) The transition probabilities of J-to-J and U-to-J against the transition probability of C-to-C.

