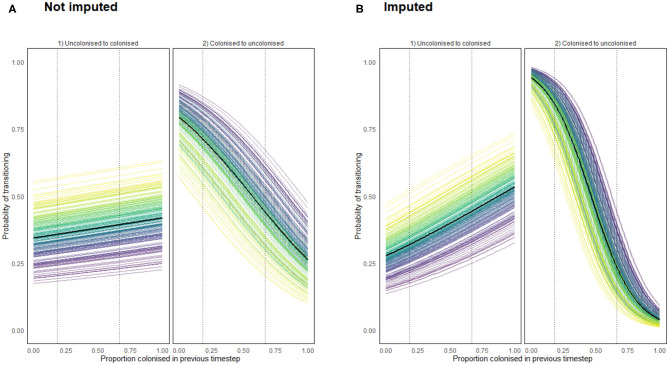
Figure 11.
Transition probabilities from a state of uncolonization (by Campylobacter) to colonization, and from colonization to uncolonization using a density dependent model programmed using (A) recorded data (B) recorded and imputed data. Each colored line represents the transition probabilities for a single chicken, with a black line depicting the flock mean. Dotted lines show the region for which data was available for such a flock colonization proportion.

