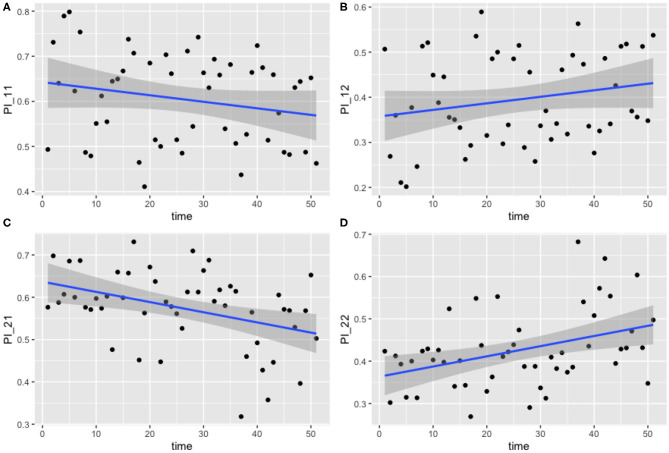
Figure 4.
Transition probabilities between two states, “uncolonized” and “colonized.” Plots show (A) π1,1,t, (B) π1,2,t, (C) π2,1,t, and (D) π2,2,t against time. Each point is the calculated transition probability for that time point. Also plotted is a linear regression against these points in blue, with a shaded region depicting the 95% confidence interval of the regression. (C,D) Are significant (p < 0.01).

