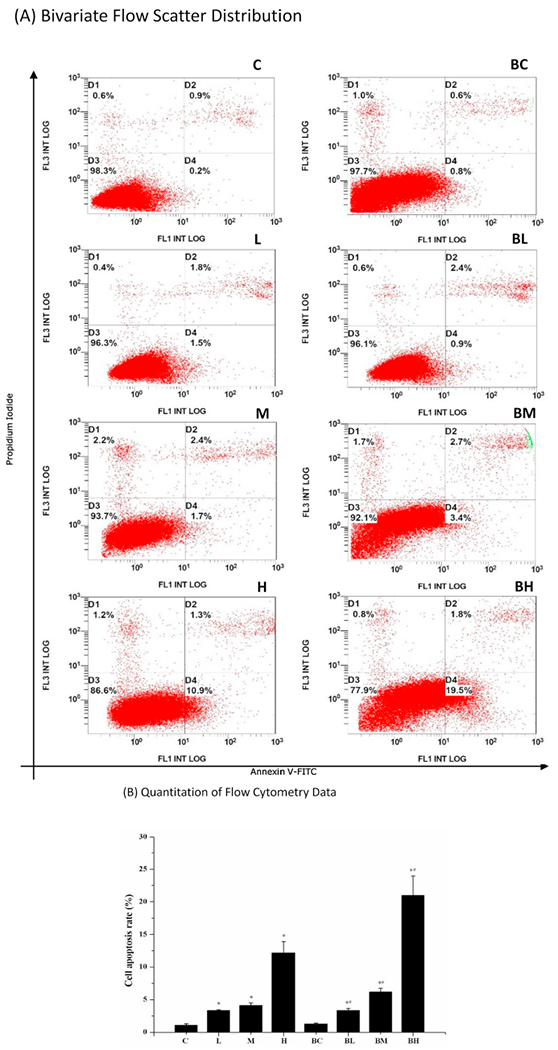
Fig. 4.

Flow cytometry study of apoptosis. (A) Bivariate flow scatter plot. The horizontal axis represents the Annexin V signal and the vertical axis represents the PI signal. Signals in D3 represent the normal living cells, while signals in D2 and D4 indicate the necrotic and early withered cells, respectively. (B) Quantitation of flow cytometry data. Data represent mean ± SEM, n = 3 of independent experiments. *: p < 0.05 as compared to Group C; #: p < 0.05 as compared to Group BC.
