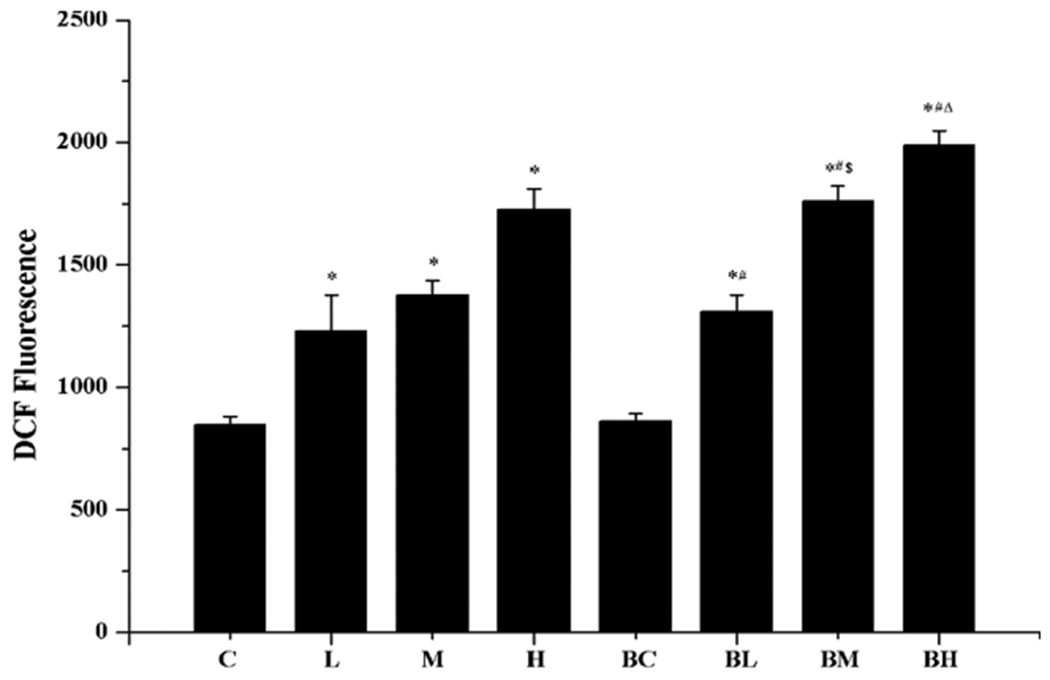
Fig. 5.

Increased ROS production after Mn exposure. See the legend to Fig. 2 for treatment details. Data represent mean ± SEM, n = 3 of independent experiments. *: p < 0.05 as compared to Group C; #: p < 0.05 as compared to Group BC; $: p < 0.05 as compared to Group M; Δ: p < 0.05 as compared to Group H.
