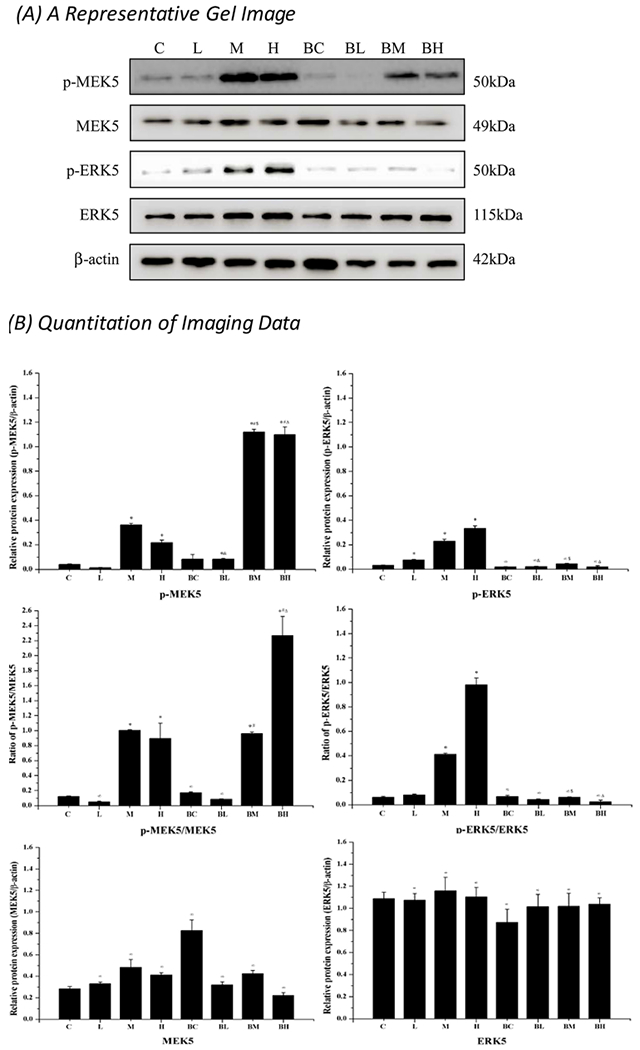
Fig. 8.

Western blot analysis of p-MEK5 and p-ERK5. (A) A typical gel imaging of studied proteins. (B) Quantitative data of the Western blot studies. Data represent mean ± SEM, n = 3 of independent experiments. *: p < 0.05 as compared to Group C; #: p < 0.05 as compared to Group BC; &: p < 0.05 as compared to Group L. \: p < 0.05 as compared to Group C.
