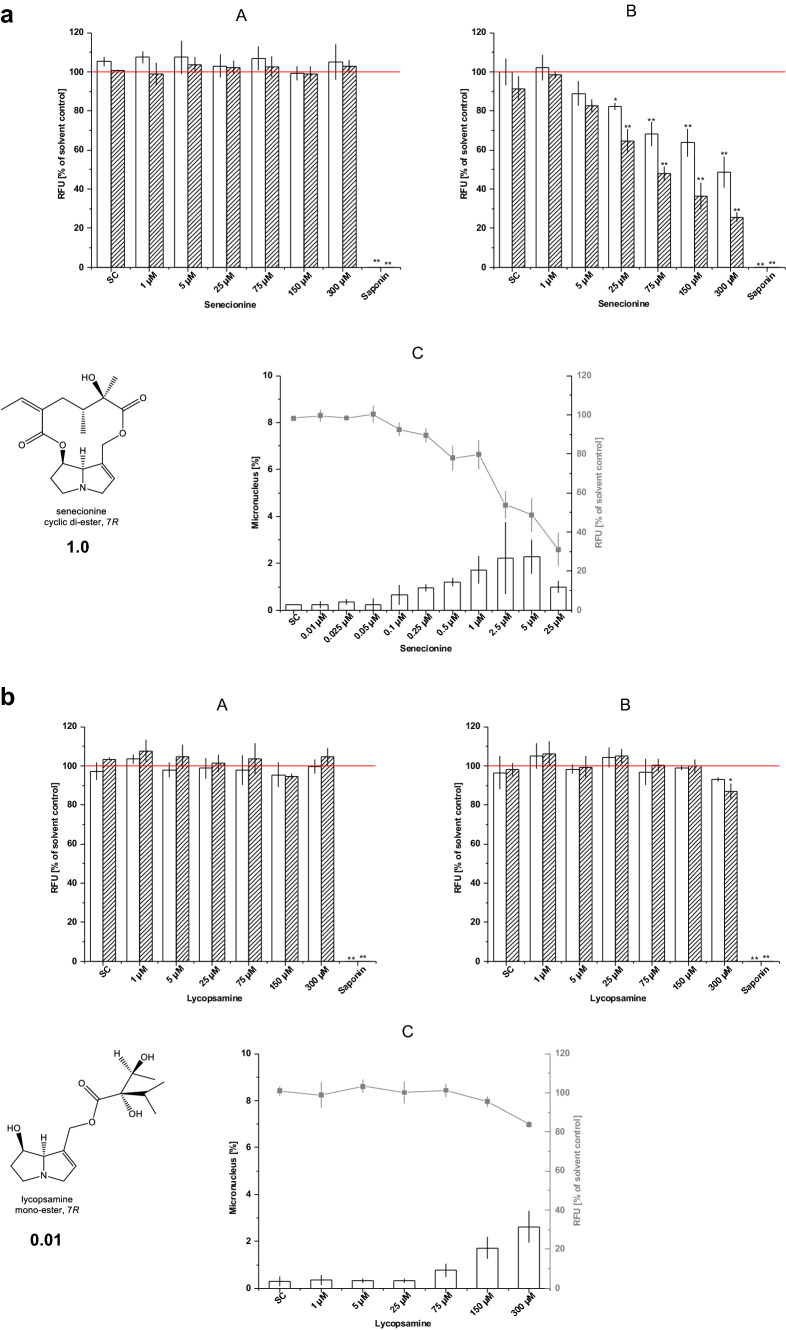
Fig. 1.
a Cytotoxicity and micronuclei formation in HepG2 cells (upper left), HepG2-CYP3A4 cells (upper right) and micronuclei levels (lower, bars) in HepG2-CYP3A4 cells treated with senecionine. The cytotoxicity in HepG2-CYP3A4 cells under the conditions of the micronuclei assay (with recovery) is also shown (-■-). Data represent mean ± S.D. from n = 3 independent experiments. b Cytotoxicity and micronuclei formation in HepG2 cells (upper left), HepG2-CYP3A4 cells (upper right) and micronuclei levels (lower, bars) in HepG2-CYP3A4 cells treated with lycopsamine. The cytotoxicity in HepG2-CYP3A4 cells under the conditions of the micronuclei assay (with recovery) is also shown (-■-). Data represent mean ± S.D. from n = 3 independent experiments

