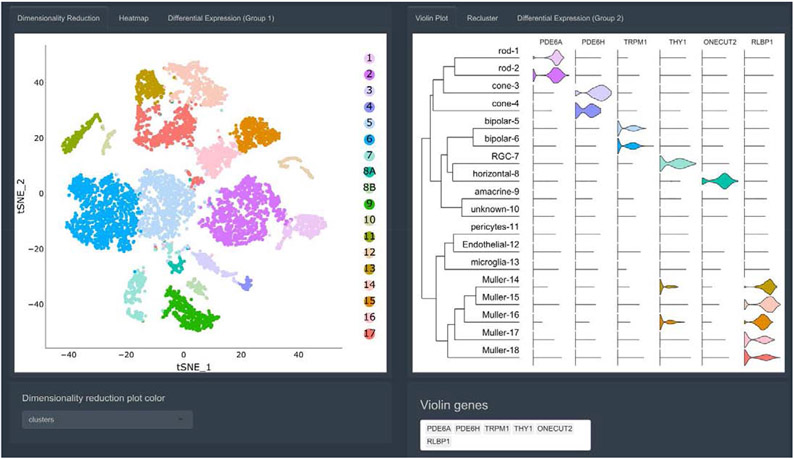
Figure 1: Screenshot of cluster-level expression analysis in Spectacle.
Visualization of clusters from foveal and peripheral retinal cells with tSNE-based dimensionality reduction (left). The plots are interactive, allowing zooming in on regions of interest and hovering over individual cells to identify the cell type and originating library. Violin plots (right) depict cluster-level expression for one or more genes of interest. A dendrogram is appended on the left side of the violin plots to demonstrate the relationships between all clusters.

