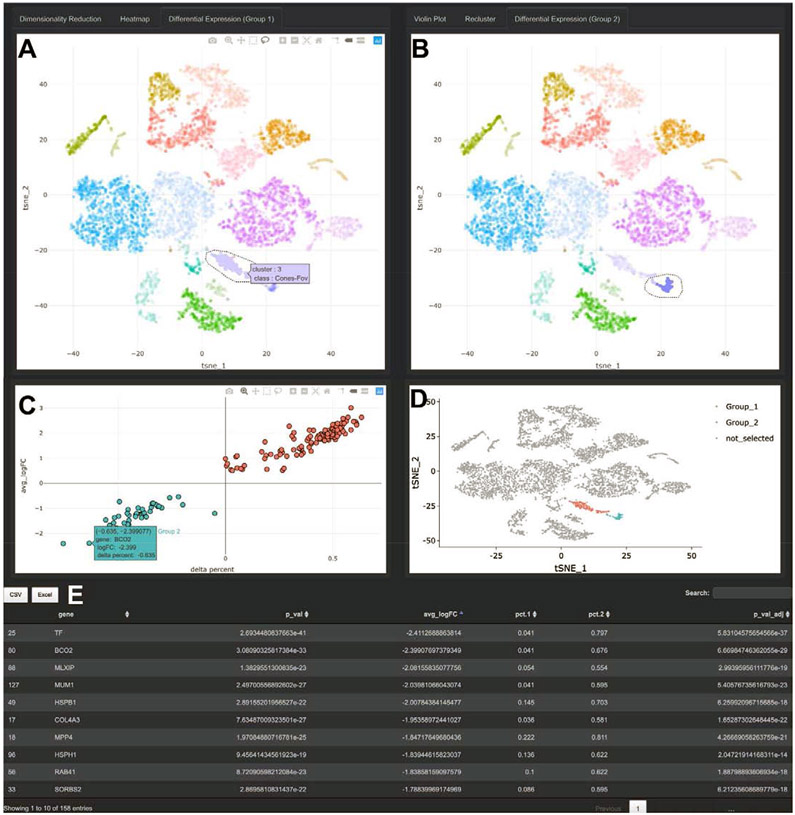
Figure 3: Differential Expression in Spectacle.
A-B. Differential expression can be performed between pre-characterized clusters of cells or interactively selected populations with the lasso tool, with cells selected on the left belonging to “Group_1” (A) and cells selected on the right belonging to “Group_2” (B). In addition to comparing expression between selected populations, differential expression can be performed between cells in the same region originating from different biological conditions, such as disease status (not shown). C. Differential expression results are displayed graphically. The y-axis depicts the log of the fold-change between cells in the Group_1 and Group_2 selections. The x-axis depicts a variable called “delta percent,” which represents the percentage of cells in Group_1 samples that express each gene minus the percent of cells in Group_2 samples that express the gene. For example, the gene BCO2 is expressed by 4.1% of cells in Group_1 and 67.6% of cells in Group_2, resulting in a delta percent of 0.041 minus 0.676 = −0.635. This visualization allows for the expression level (y-axis) and the proportion of expressing cells (x-axis) to be simultaneously evaluated. D. The cell selections are re-depicted on the standard dimensionality reduction space. E. In addition to graphical output, the differential expression results are displayed in tabular format, and can be exported to CSV or Excel files.

