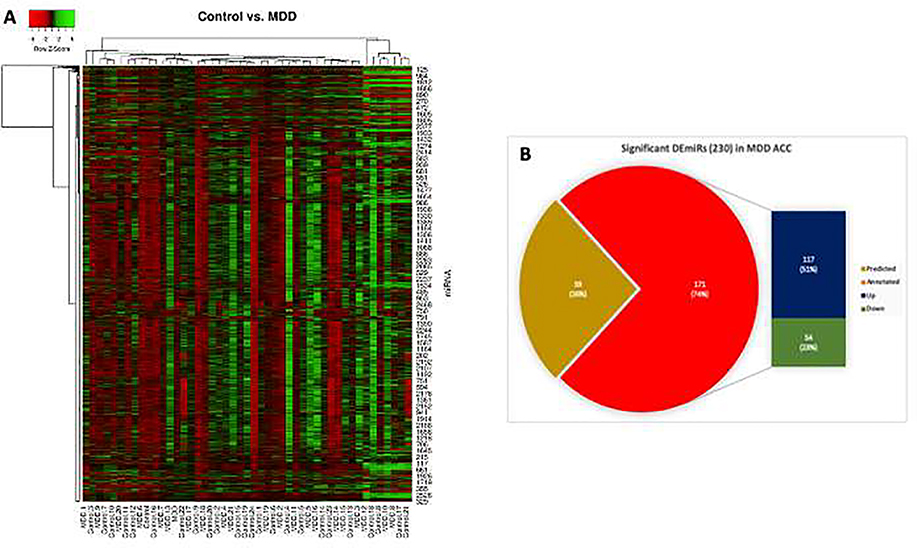
Fig. 1: miRNA expression heatmap and differentially expressed miRNAs.
A) All 2540 annotated miRNAs and their normalized values between MDD and control (n = 22 vs 25) subjects were plotted in an expression heatmap with hierarchical clustering. Green and red color in the map show higher and lower expression values respectively. For the clustering purposes, the Euclidean method was used to measure the distance, and the average linkage algorithm was applied to calculate the average pairwise distance between all pairs of points. Following the average linkage clustering algorithm, the dendrogram was constructed to demonstrate the expression similarities. B) MDD specific numerical distribution of significantly altered miRNAs was presented with a bar of pie diagram. The pie plot shows the distribution of differentially expressed 171 annotated miRNAs and 59 predicted miRNAs based on their significance level (p<0.05). The 117 up and 54 downregulated miRNAs from the list of 171 annotated miRNAs were plotted with a bar diagram.

