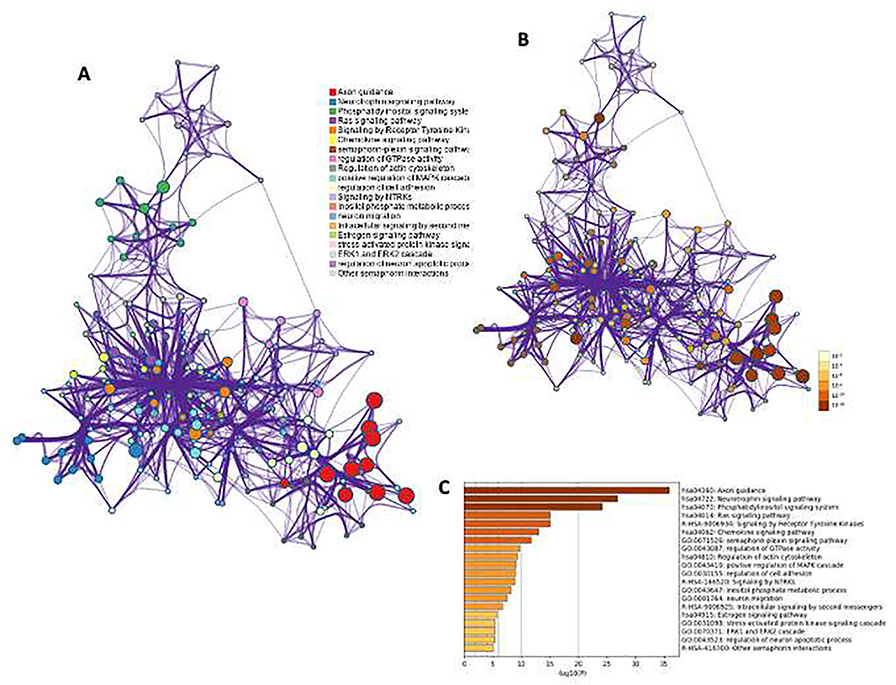
Fig. 4: The enrichment visualization network based on overrepresented gene list.
A) The network was mapped with 20 enriched terms connected by two major domains and three smaller sub-domains. B) Representation of same enrichment network with colored coded (nodes) p-value. The darker the color, the more statistically significant the node is (see legend for p-value ranges) and C) the same enrichment terms presented listed up as a color-coded bar plot.

