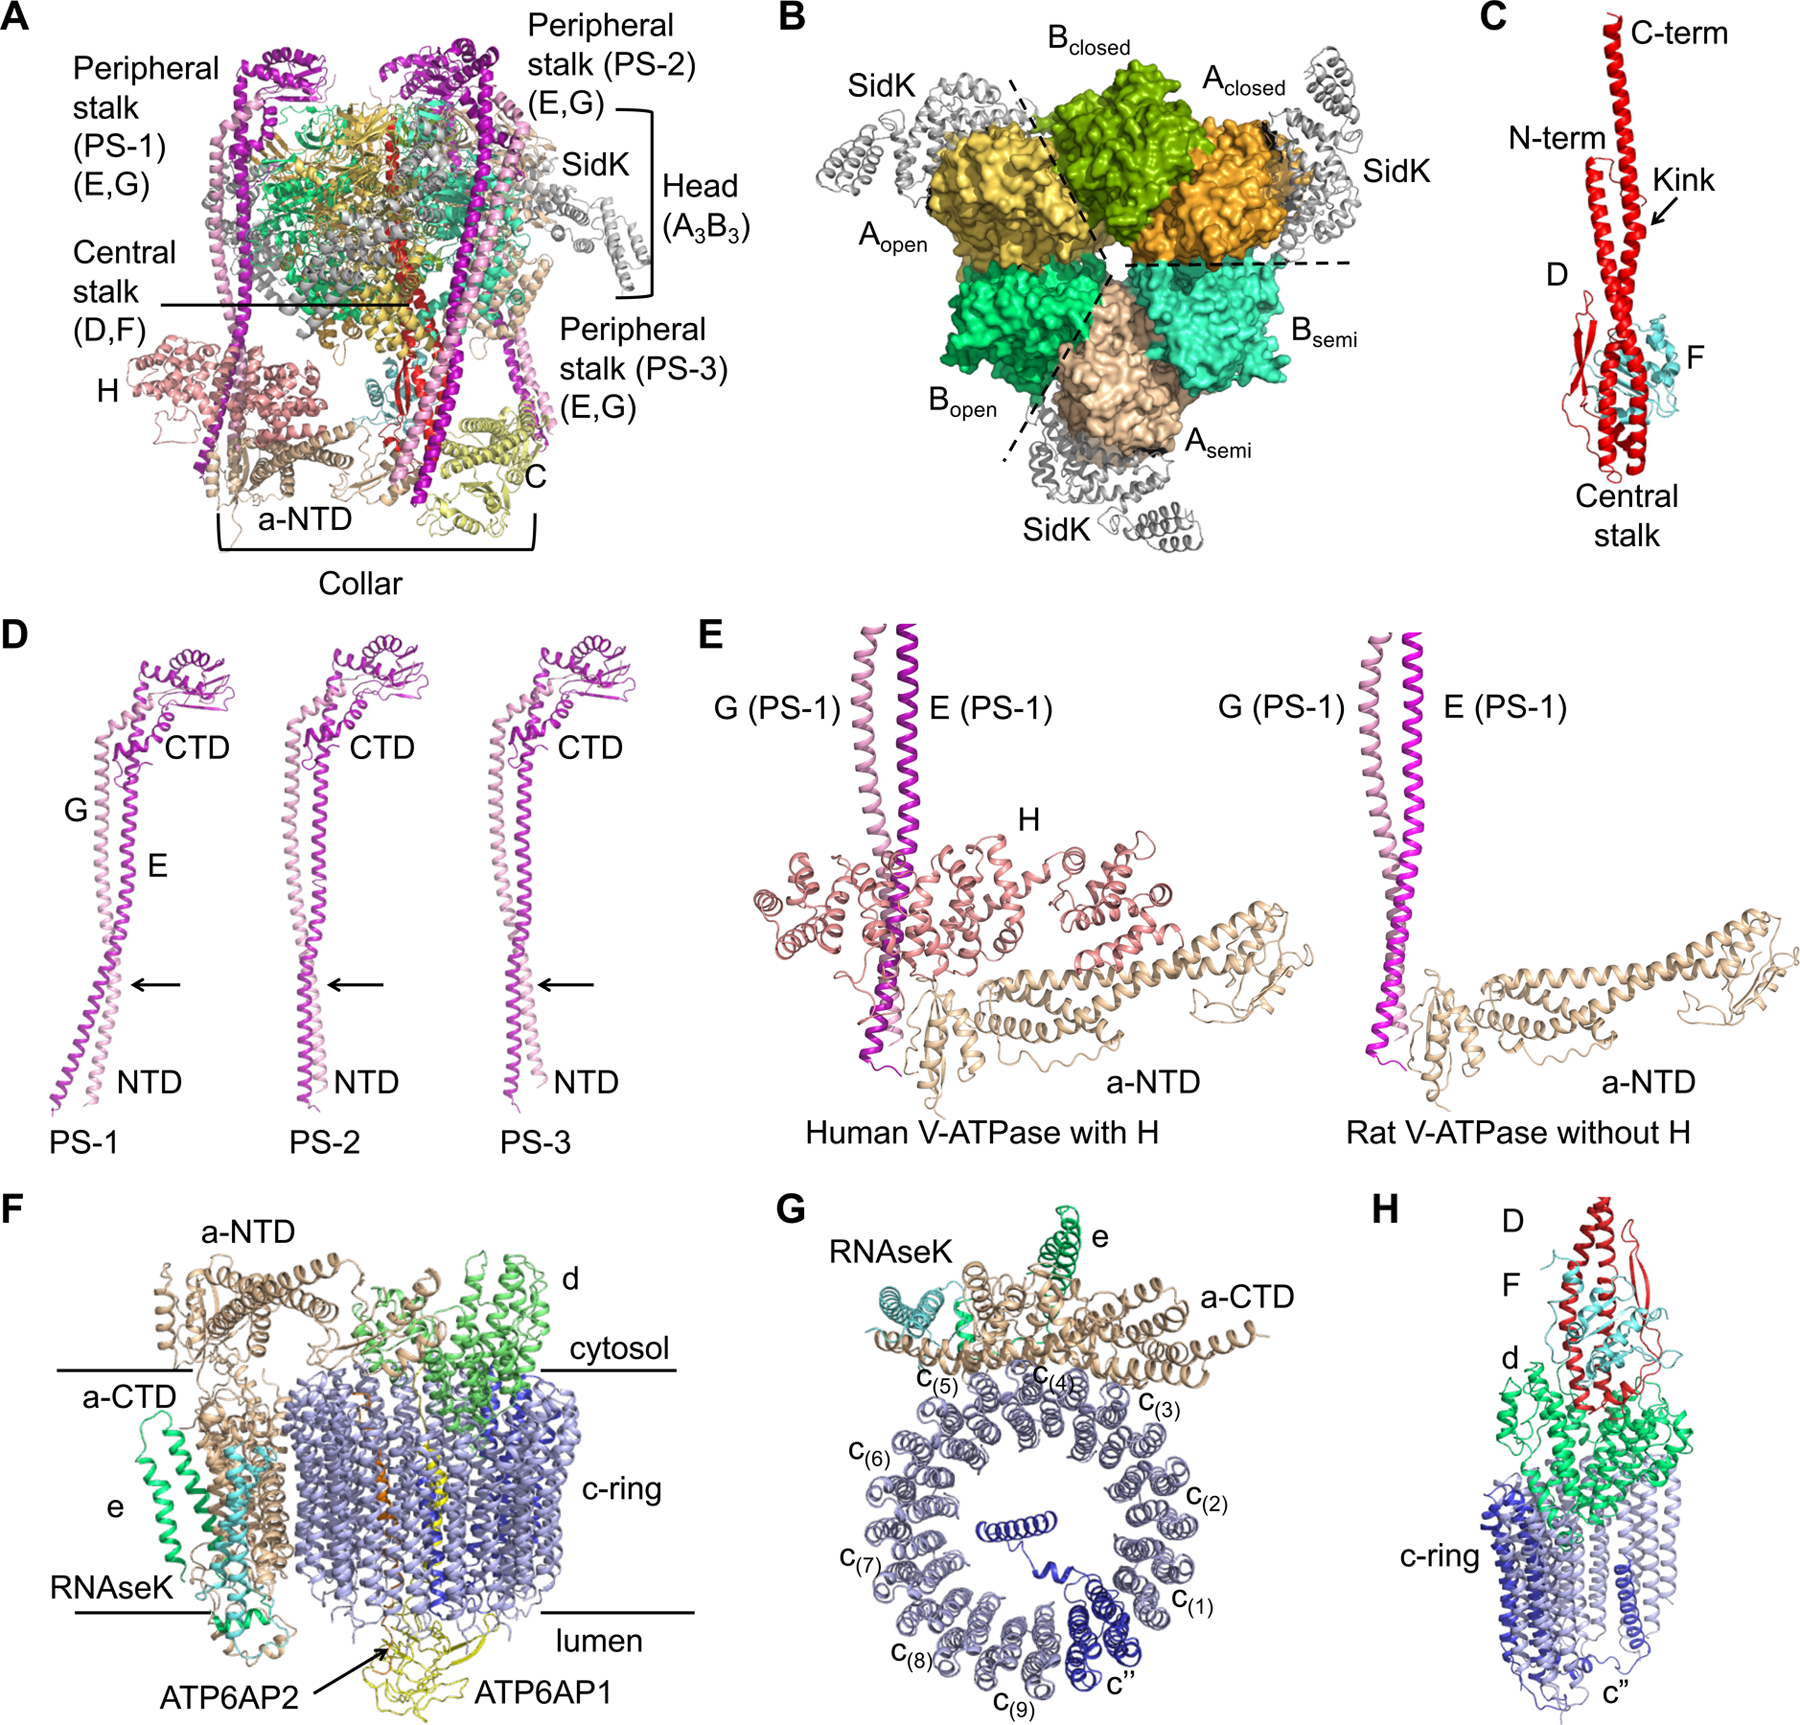
Figure 2. Assembly of the V1 and Vo Complex.

(A) Ribbon diagram of the V1 complex with each subunit colored as in Figure 1.
(B) The A3B3 hexamer surrounded by SidK (grey). The A3B3 hexamer is composed of three pairs of AB heterodimer in three conformations, closed, semi-open (semi) and open.
(C) Ribbon diagram of the central stalk that is composed of subunit D (red) and F (cyan). The proline containing kink in subunit D is indicated by an arrow.
(D) Conformational differences of the three peripheral stalks, with the CTDs of subunit E (purple) and subunit G (pink) aligned.
(E) Comparison between human and rat V-ATPase structures at the region where H is localized.
(F) Ribbon diagram of the Vo complex with each subunit colored as in Figure 1.
(G) Ribbon diagram of c-ring (blue) with CTD of subunit a (wheat), e (green) and RNAseK (cyan). The c” subunit is colored in marine.
(H) Interactions of subunit d (green) with the DF stalk (red and cyan) and the c-ring (blue).
See also Figure S3.
