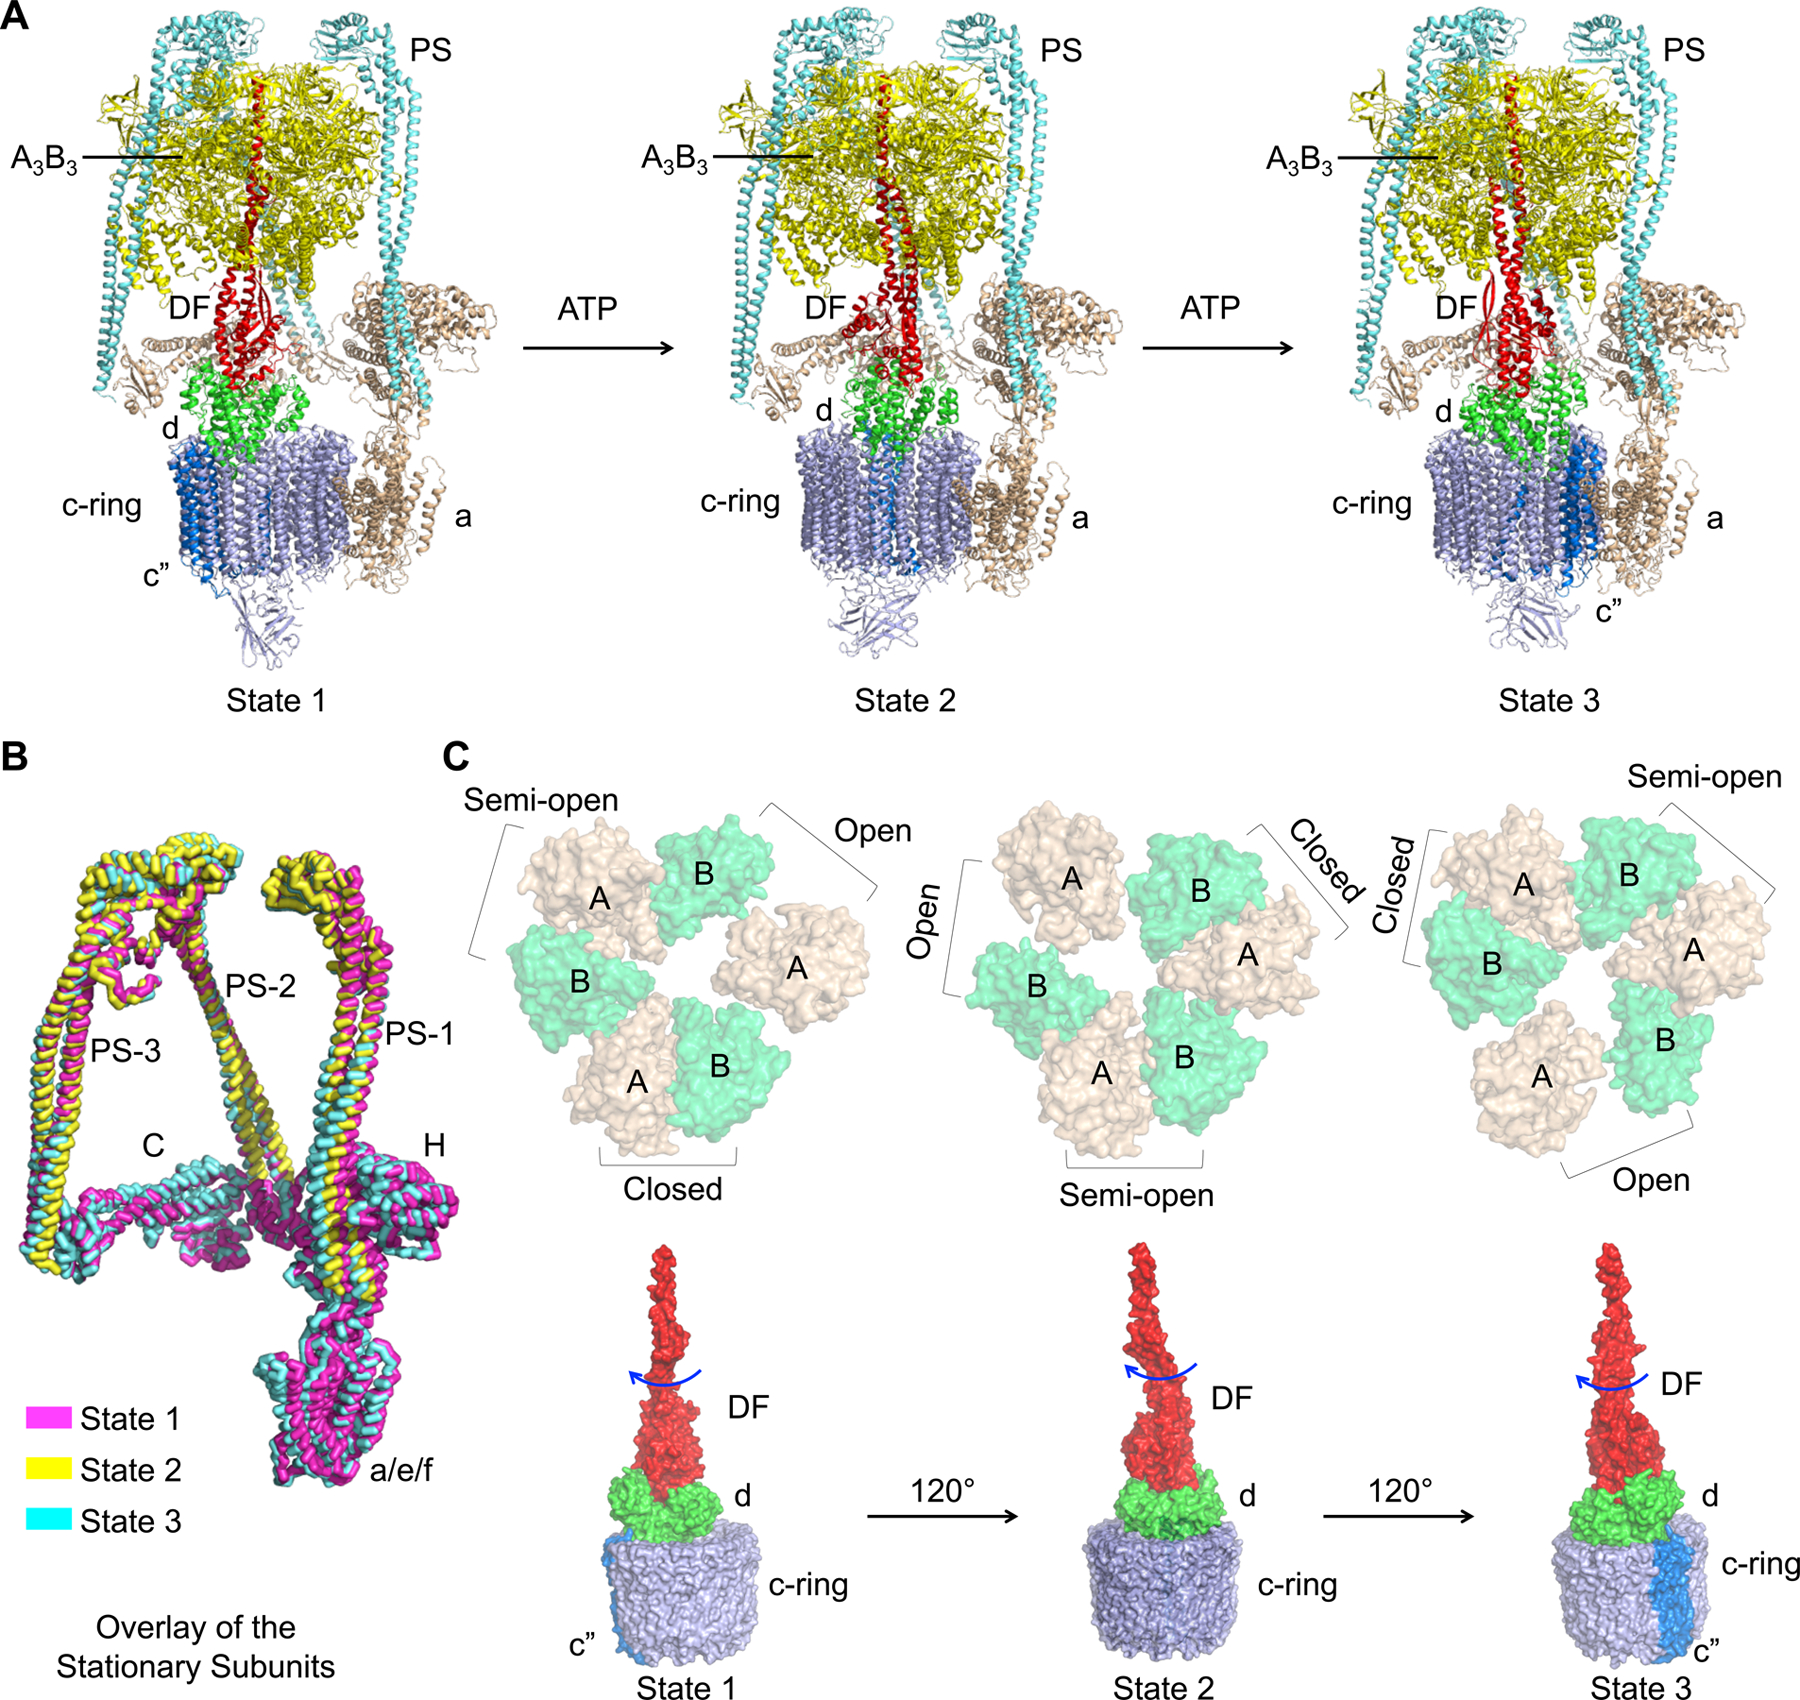
Figure 3. Molecular Coupling between V1 and Vo Complexes.

(A) Ribbon diagrams of the three rotational states of human V-ATPase with the central stalks in red, peripheral stalks in cyan, A3B3 head in tv-yellow, C, H, a, e and RNAseK in wheat, c-ring, ATP6AP1 and ATP6AP2 in blue, and d in green.
(B) Overlaid stationary subunits of human V-ATPase structures in three rotational states (state 1 in magenta, state 2 in yellow, and state 3 in cyan).
(C) Coordinated changes from the A3B3 head to the rotary DF-d-c-ring unit, shown in surface representations. The CTD hexamers of the A3B3 head (in wheat and green, top) are viewed from the Vo side, displaying the conformational precession between the states. The rotary units containing the central stalk (red), d (green) and the c-ring (blue) (bottom) are presented as side views, showing the ~120° rotation between states in response to the conformational precession at the A3B3 head.
