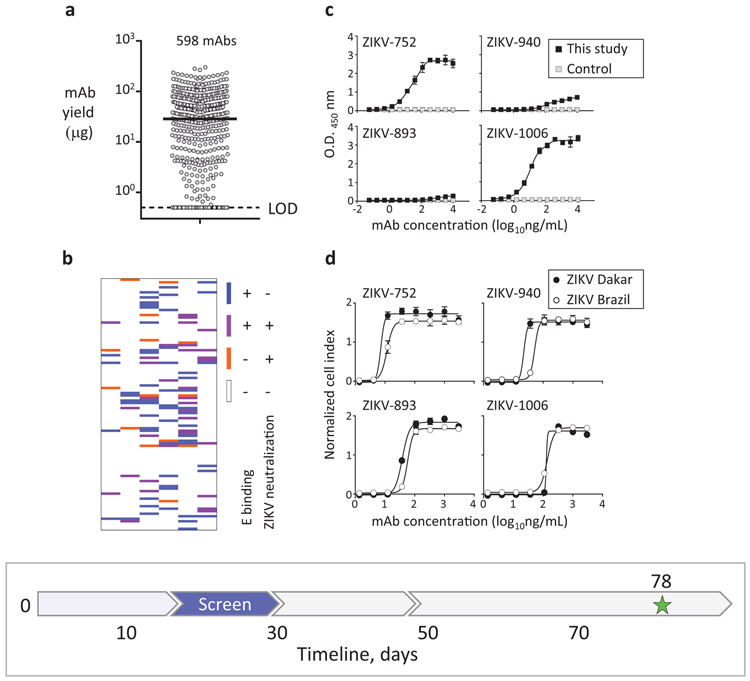
Fig. 3: Rapid mAb production and screening to identify lead candidates for in vivo testing.
a, Micro-scale expressed and purified mAbs. Dots indicate average concentration of individual mAbs from assay duplicates, and median mAb yield is shown with horizontal line. LOD – limit of the detection. b, Relationships between binding and neutralizing activities of individual mAbs of the panel shown as a heatmap. Binding to E protein was determined by ELISA and neutralizing activity was measured using RTCA from mAbs purified as in (a). c, ZIKV E protein binding by potently neutralizing mAbs representing three distinct epitope binding groups. MAb rRSV-90, which is specific to the unrelated respiratory syncytial virus (RSV) fusion protein (F) antigen, served as a control. d, Neutralization of ZIKV Brazil or Dakar strain viruses by representative cross-neutralizing mAbs from (c), as determined using RTCA. Data shown indicate the mean ± SD of assay triplicates in (c, d), and represent at least two independent experiments. Timeline to identify mAb candidates for in vivo testing is indicated with a blue arrow in the timeline chart.

