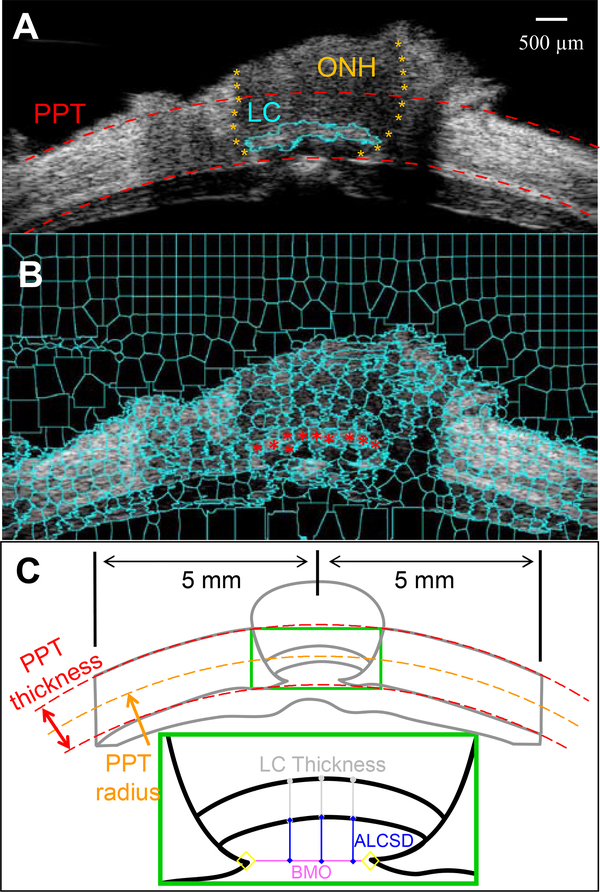
Figure 2:
A. The cross-sectional ultrasound images were manually segmented to delineate the ONH-PPT boundaries (orange asterisks) based on the differences in tissue echogenicity. The dashed red curves are circle fitted to the inner and outer PPT surfaces, which bound the ROI for displacement analysis. The retina is largely excluded from the ROI. B. The LC was segmented out in this eye using the superpixel method. The ultrasound image was decomposed into superpixels (cyan cells) using an automated algorithm. Superpixels belonging to the LC were manually identified (red dots). C. BMO was manually identified in ultrasound B-mode images. The ACLSD was calculated as the average perpendicular distance from three points (at 1/3, 1/2, and 2/3 width) on the ALCS perpendicular to the BMO reference plane. LC thickness was calculated as the average distance from the same three points to their corresponding points on the posterior LC surface.

